
Categoria: news

  • Singapore GDP Surges 5.9% as AI Boom Fuels Growth Outlook

    Singapore GDP Surges 5.9% as AI Boom Fuels Growth Outlook

    Singapore’s economy expanded by 5.9% year-on-year in the second quarter of 2026, surpassing the government’s initial advance estimate of 5.7%, according to official data released on Tuesday.

    Upgraded Economic Forecasts

    The Trade Ministry confirmed that GDP growth reached 6.1% for the first half of the year. Consequently, the government has significantly upgraded its full-year growth forecast to a range of 4.5% to 5.5%, up from the previous projection of 2.0% to 4.0%. Officials cited a global AI investment boom that exceeded expectations and a less severe economic impact from the Middle East conflict than originally anticipated.

    “Against this backdrop, the 2026 outlook for sectors of the Singapore economy that are linked to the AI-driven technology cycle has improved, although that for sectors directly affected by supply disruptions arising from the Middle East conflict remains weak,” the ministry stated.

    Stronger Quarter-on-Quarter Performance

    On a quarter-on-quarter, seasonally adjusted basis, the nation’s gross domestic product grew by 1.4% between April and June, outperforming the 1.1% growth previously estimated.

    Trade and Export Resilience

    In a separate report, Enterprise Singapore significantly raised its growth forecast for non-oil domestic exports to between 14% and 16%, a sharp increase from the previous range of 3% to 5%.

    “The global economy has remained more resilient than expected, bolstered by the sustained AI-related demand and capex spending,” Enterprise Singapore noted, while cautioning that risks such as the Iran war and potential new U.S. tariffs persist.

    Monetary Policy and Inflationary Pressures

    The Monetary Authority of Singapore (MAS) projects firm growth for the remainder of 2026, though it identified the long-term sustainability of the AI investment surge as a primary risk factor. In late July, the central bank took the unexpected step of tightening monetary policy, pointing to persistent inflationary pressures driven by high energy costs linked to the Middle East conflict.

    To assist households and businesses with rising energy expenses, the government unveiled a S$900 million support package, building on a previous S$1 billion initiative announced in April.

    Current central bank projections place core and headline inflation for 2026 between 1.5% and 2.5%, an increase from the earlier 1.0% to 2.0% forecast. Annual inflation stood at 1.6% in June, with expectations that it will remain elevated through the first half of next year. July inflation figures are scheduled for release later this month.

  • Equinix Q2 2026: AI Demand Triggers Massive Guidance Hike

    Equinix Q2 2026: AI Demand Triggers Massive Guidance Hike

    Equinix (EQIX) reported a standout second quarter on July 29, 2026, driven by an accelerating AI-led infrastructure cycle. The data center giant surpassed expectations, delivering 11% year-over-year growth in monthly recurring revenue (MRR) and announcing the largest single guidance increase in company history, fueled by record-breaking interconnection demand and a massive backlog.

    AI as the Catalyst for Growth

    CEO Adaire Rita Fox-Martin highlighted that the AI-driven infrastructure shift is playing directly to Equinix’s strengths. Demand for neutral, interconnected sovereign infrastructure is compounding, with the company recording its third consecutive quarter of double-digit MRR growth. Total sales activity, including annualized gross bookings and presales, surged over 30%, while net interconnections hit an all-time high of 9.7 thousand.

    Reflecting this momentum, Equinix has raised its full-year 2026 revenue growth outlook to 11%–12%, with AFFO per share growth now expected between 10% and 12%. To keep pace with this demand, the company is doubling its cabinet delivery capacity for the second half of the year, pushing 2026 capital expenditure expectations to between $5 billion and $6 billion.

    Long-Term Expansion and Strategic Investment

    Looking toward 2029, Equinix is positioning itself for sustained growth well beyond its previous outlooks. The company plans to invest $5 billion to $7 billion annually in CapEx through 2029, targeting high-conviction projects that promise mid-20 percent yields. This strategy focuses on 33 markets and 52 major projects, with over 80% of expansion concentrated in the company’s top 25 global metros.

    CFO Olivier Leonetti emphasized that the company’s balance sheet remains a strategic differentiator. With $7.7 billion in available liquidity, Equinix is well-equipped to fund this expansion while maintaining investment-grade credit ratings. The long-term forecast through 2029 anticipates total revenue growth of 10%–13% annually and a target adjusted EBITDA margin of 53% or higher.

    Solving Modern Enterprise Complexity

    The company’s leadership noted that modern enterprise workloads are becoming increasingly distributed, requiring more than just raw compute power. Customers are seeking “connectivity at the intersection of everything,” a role Equinix fills by serving as the neutral exchange for cloud, AI, and networking workloads. Currently, 8 of the top 10 model providers and 8 of the top 10 neo-clouds utilize Equinix for their key networking requirements.

    Strategic partnerships, such as those with Cisco and NVIDIA for AI factory blueprints, and the introduction of “Fabric Geo Zones” to address data sovereignty, are critical components of the company’s product roadmap. These initiatives, coupled with the appointment of Chris Audi as Chief Product Officer, aim to further accelerate the delivery of standardized, business-ready colocation solutions like “Secure Cabinet Express.”

    Operational Execution and Financial Discipline

    Equinix’s Q2 performance demonstrated high operational efficiency. Adjusted EBITDA margins rose to 53%, a 300-basis-point improvement year-over-year. The company successfully closed 134 megawatts of xScale leases during the quarter, contributing significantly to non-recurring revenue.

    Management remains confident in the durability of the current market cycle. By leveraging a proprietary demand model and maintaining deep relationships with utility providers and contractors, Equinix is successfully navigating the power-constrained landscape. As the company continues to scale, it aims to drive further margin expansion through standardized processes, automation, and a relentless focus on its core enterprise customer base.

  • Parsons (PSN) Q2 2026: Strategic Growth Amid Portfolio Shifts

    Parsons (PSN) Q2 2026: Strategic Growth Amid Portfolio Shifts

    Parsons Corporation (PSN) delivered a robust second quarter in 2026, characterized by significant margin expansion and strong bookings, even as the company navigated strategic portfolio adjustments. The firm reported a 70 basis point increase in Critical Infrastructure margins, building on last year’s 40 basis point growth. Contract awards surged 24% year-over-year, achieving an enterprise book-to-bill ratio of 1.2x, signaling sustained demand across both Federal Solutions and Critical Infrastructure segments.

    Market Momentum and Technology Leadership

    Parsons continues to leverage its technology leadership as a primary competitive differentiator. This quarter, four of the company’s five major contract wins—each exceeding $100 million—incorporated artificial intelligence. Over the last nine months, Parsons has secured 13 contracts of this scale, with 10 utilizing advanced AI, including applications in autonomous cyber, electronic warfare, and smart mobility.

    Key wins this quarter include:

    • A 2-year, $514 million option under the Missile Defense Agency’s TEAMS contract.
    • $400 million in Other Transaction Agreements (OTAs) focused on mission-critical defense and intelligence solutions.
    • A 5-year, $245 million IDIQ contract with the U.S. Naval Research Laboratory for software and cybersecurity enhancements.
    • A 7-year, $184 million IDIQ contract for the Department of Navy’s Intelligence Carry-on program.
    • A $161 million contract for the Canadian Giant Mine Remediation Program.

    Strategic Portfolio Shaping

    Management highlighted a disciplined approach to portfolio optimization. Parsons is divesting non-core assets to focus on higher-margin, high-growth opportunities. This includes exiting certain SETA (Systems Engineering and Technical Assistance) contracts to avoid organizational conflicts of interest, thereby freeing the firm to pursue larger development roles that offer 8 to 10 times the market opportunity.

    “We reshaped our portfolio to align with our long-term strategy and redirected resources toward higher-margin, higher-growth work,” said Carey Smith, Chair, President, and CEO of Parsons. The company also addressed a $41 million charge related to a legacy joint venture project, noting that it has not pursued such consortium business models since 2019, marking a permanent shift in operational strategy.

    Financial Outlook and Guidance

    For fiscal year 2026, Parsons updated its guidance, projecting revenue between $6.2 billion and $6.5 billion, with adjusted EBITDA in the $500 million to $560 million range. The adjustment accounts for planned divestitures, the impact of the joint venture charge, and timing-related delays in federal funding and large infrastructure awards.

    Despite these adjustments, the company maintains a strong backlog of $9.3 billion, with 71% of that total currently funded. Leadership remains confident that the underlying strength of the business—driven by bipartisan support for defense spending and infrastructure investment—positions Parsons for accelerated growth in the second half of 2026 and into 2027.

    Global Infrastructure and Defense Demand

    The Critical Infrastructure segment continues to perform exceptionally well, particularly in the Middle East, which saw 10% organic revenue growth this quarter. Parsons expects long-term potential in reconstruction efforts in the Middle East and Ukraine, while North American operations remain aligned with the Infrastructure Investment and Jobs Act. On the federal side, the administration’s proposed $1.15 trillion defense budget for FY 2027 aligns closely with Parsons’ core capabilities in missile defense, cyber, and space, reinforcing the company’s long-term growth trajectory.

  • 4 Dividend Stocks to Buy Before August 11: Don’t Miss Out

    4 Dividend Stocks to Buy Before August 11: Don’t Miss Out

    To secure upcoming dividends from four specific companies, investors must purchase their shares no later than Tuesday, August 11, 2026. Because these stocks share a record date of Wednesday, August 12, 2026, the T+1 settlement cycle dictates that buying on or after the ex-dividend date of August 12 will result in the seller, rather than the buyer, collecting the payment.

    The distinction between the ex-date and the pay date is critical. The ex-date serves as the gatekeeper for dividend eligibility, while the pay date is simply when the cash is deposited into the shareholder’s account, usually weeks later.

    First Business Financial Services (NASDAQ:FBIZ)

    First Business Financial Services declared a quarterly dividend of $0.34 per share, payable on August 26. The Wisconsin-based commercial bank has seen its shares climb 32.6% year-to-date and 53.6% over the last year.

    Financial coverage remains strong, with the payout representing roughly 18% of Q2 2026 EPS. The bank reported diluted EPS of $1.84, surpassing the $1.56 consensus. Furthermore, the net interest margin expanded to 3.78%, with loan growth at 10.3%. However, investors should monitor credit quality, as nonperforming assets rose to $38.1 million from $28.7 million in the prior year.

    FTAI Aviation (NASDAQ:FTAI)

    FTAI Aviation announced a quarterly dividend of $0.50 per share, payable on August 24. This marks the company’s fourth consecutive dividend increase. Despite this growth, the stock carries notable risks.

    While the Q2 2026 diluted EPS of $1.13 covers the $0.50 payout, the company missed consensus EPS estimates by 25.85%. Net income dropped to $125.09 million from $161.69 million, and management lowered its Aviation Leasing adjusted EBITDA guidance from $575 million to $475 million. Additionally, the balance sheet reflects significant leverage, with $3.45 billion in long-term debt against $403.99 million in shareholders’ equity.

    Western New England Bancorp (NASDAQ:WNEB)

    Western New England Bancorp, the parent company of Westfield Bank, declared a $0.07 quarterly dividend payable August 26. With recent EPS at $0.18, the payout ratio sits at approximately 39%.

    The bank’s performance was impacted by a 25% miss on consensus EPS estimates, largely due to a $1.8 million partial charge-off on a commercial real estate loan following a borrower’s Chapter 11 bankruptcy. While total criticized loans rose to 2.9%, management anticipates recovering $1.6 million through the sale of collateral. Core operations remain resilient, with net interest margin expanding 20 basis points to 3.00%.

    Winmark (NASDAQ:WINA)

    Winmark, the franchisor behind brands like Plato’s Closet and Once Upon A Child, declared a dividend of $1.02 per share, payable on September 1, 2026. To qualify, investors must hold the shares by the August 11 deadline.

    Winmark reported Q2 2026 diluted EPS of $2.81, missing the $3.14 consensus estimate, though the dividend remains well-covered with a payout ratio of roughly 36%. Recurring royalty revenue grew to $20.12 million. The company’s balance sheet shows negative shareholders’ equity of $37.6 million, a byproduct of aggressive share buybacks and dividends, which are supported by healthy free cash flow of $44.7 million in FY2025.

    Chasing dividends should never be the sole basis for an investment strategy, particularly as these payments are modest relative to share prices. Investors must conduct thorough due diligence before the August 11 deadline. If a stock does not offer long-term value on its own, a single dividend check will not compensate for a poor underlying investment.

  • Mesa Labs Q1 Earnings: CEO Kadia Tackles Execution Hurdles

    Mesa Labs Q1 Earnings: CEO Kadia Tackles Execution Hurdles

    Mesa Laboratories (NASDAQ:MLAB) reported a 1% revenue increase to $60.1 million for the first quarter of fiscal 2027, as new CEO Siddhartha Kadia prioritized operational execution, debt reduction, and resolving fulfillment challenges in the company’s Sterilization and Disinfection Control (SDC) segment.

    Financial Performance and Margin Expansion

    Despite modest revenue growth, Mesa demonstrated significant bottom-line progress. Gross profit climbed to $39 million, representing 64.9% of revenue—a notable jump from 62% in the prior year. CFO John Sakys credited this improvement to supply-chain efficiencies, reduced reliance on third-party consultants, and a favorable product mix.

    Operating expenses saw a 5.6% decline to $32 million, driven by disciplined cost controls and lower stock-based compensation. Consequently, GAAP operating income surged 129% to $7 million, while adjusted operating income rose 16.5% to $15 million, or $2.61 per diluted share.

    Addressing the Sterilization and Disinfection Control (SDC) Segment

    As Mesa’s largest business unit, SDC accounted for 41% of quarterly revenue but faced a 3.6% organic sales decline. CEO Siddhartha Kadia was candid regarding the shortfall, attributing it to internal fulfillment issues rather than a lack of market demand.

    “The problem is that we missed delivery dates on orders we already hold,” Kadia stated during the earnings call. To rectify this, the company has tasked its senior vice president of operations with streamlining cycle times and reducing process variability without compromising the high quality-release standards required for biological materials.

    Strategic Shifts in Biopharmaceutical Development (BPD)

    The BPD segment posted 5% organic growth to $12.1 million, a recovery from the previous quarter’s 30% decline. Management is currently rebuilding the segment’s sales pipeline and commercial strategy under new leadership. Furthermore, Mesa has reprioritized its R&D efforts to accelerate the launch of its next-generation Gyrolab automated immunoassay platform, now slated for a fiscal 2028 release.

    Capital Allocation and Future Outlook

    Mesa remains focused on deleveraging, having repaid $8.7 million in debt this quarter, bringing net leverage down to 1.85 times. The company aims to reach a net leverage ratio of 1.5 to 1.75 times by the end of fiscal 2027.

    While the company did not provide specific fiscal 2027 guidance, management confirmed that current trends align with internal plans. Kadia emphasized that the immediate focus remains on maximizing the performance of existing franchises rather than pursuing aggressive acquisitions. Full-year guidance is expected to be released alongside the second-quarter results in November.

    Operational Context

    Headquartered in Lakewood, Colorado, Mesa Laboratories specializes in critical process monitoring and calibration. Its portfolio serves essential sectors, including healthcare, pharmaceuticals, and industrial manufacturing, ensuring regulatory compliance and operational safety through precision measurement technology.

  • Century Aluminum Q2 Surge: Production Hits Full Capacity

    Century Aluminum Q2 Surge: Production Hits Full Capacity

    Century Aluminum (NASDAQ:CENX) reported a robust second quarter, marked by increased shipments, higher sales, and a significant boost in adjusted EBITDA, fueled by expanded output at its Mount Holly plant and the successful restart of operations in Iceland.

    Operational Milestones and Growth

    Shipments for the second quarter climbed 6% sequentially to approximately 131,000 tons. Net sales followed suit, rising $103 million to reach $752 million. This growth was primarily driven by favorable London Metal Exchange (LME) aluminum prices, stronger regional premiums, and higher volume outputs.

    The company posted a net income of $249 million, or $2.39 per share. Excluding non-recurring items—such as derivative gains, business-interruption losses, and restart expenses—adjusted net income stood at $257 million, or $2.46 per share. Adjusted EBITDA saw a substantial jump of $96 million from the previous quarter, totaling $327 million.

    Mount Holly and Grundartangi Plant Updates

    CEO Jesse Gary confirmed that Century reached its objective of operating all company assets at full capacity by the end of July. At the Mount Holly facility in South Carolina, the restart of the final 90 pots was completed on time and within budget. This expansion increases U.S. primary aluminum production by nearly 10% and has created over 150 full-time jobs.

    While the second quarter only captured a partial benefit from the Mount Holly restart, the company anticipates full production gains in the third quarter. In Iceland, the Grundartangi facility achieved a major win by restarting Line 2 at the end of July, roughly six months ahead of the original October schedule.

    Energy Efficiency and Strategic Developments

    Century also successfully brought its new TG4 power-generation turbine online at the Jamalco refinery in Jamaica. This move allows the site to operate on self-generated electricity, insulating the refinery from volatile grid pricing. CEO Jesse Gary estimates this will provide a financial benefit of approximately $20 per ton. However, the company is still navigating challenges related to lower-quality bauxite, with a revised mining plan expected to take another two quarters to normalize costs and volumes.

    Financial Position and Future Outlook

    Chief Financial Officer Peter Trpkovski noted that the company ended June with $388 million in cash, having successfully reduced net debt to $98 million. The company’s growth-related capital expenditures for the Mount Holly and Grundartangi projects are now largely complete.

    Looking ahead to the third quarter, Century forecasts adjusted EBITDA between $325 million and $345 million. The outlook incorporates expectations of higher LME prices and increased European duty-paid premiums.

    Expanding the Future: Oklahoma and Policy Incentives

    Century continues to advance its proposed Oklahoma smelter project in partnership with Emirates Global Aluminium. Engineering work is underway, with a final investment decision and groundbreaking targeted for late 2026. The project could receive a significant boost from a recent executive order, which offers reduced-tariff import incentives for companies expanding U.S. primary aluminum production. Century estimates it could import up to 300,000 metric tons per year at a 25% tariff rate, aiding the funding of the Oklahoma venture.

    Data Center Stake

    Beyond aluminum, Century retains a 6.8% non-dilutive interest in a data-center project at the former Hawesville site. Partner TeraWulf has secured a 20-year lease with Anthropic, potentially generating $19 billion in revenue. Century holds no funding obligations for this development and maintains the right to sell its stake back to TeraWulf one year after the project’s energization, expected in late 2027.

  • Is Trimble Stock Undervalued? Why Investors Are Watching TRMB

    Is Trimble Stock Undervalued? Why Investors Are Watching TRMB

    Trimble (TRMB) will report its second-quarter 2026 financial results on Wednesday, August 12, 2026, at 8 a.m. ET, drawing significant attention from investors as the stock potentially trades 28% below its fair value.

    Market Performance and Recent Momentum

    Currently trading at US$58.55, Trimble has seen a recent uptick with a 1-month share price return of 8.97%. Despite this short-term momentum, the broader picture remains challenging, with the stock down 25.25% year-to-date and a 29.05% decline in total shareholder return over the past year. This recent bounce from a weakened long-term base has prompted investors to reconsider their positions in the tech-driven automation and robotics sector.

    Valuation: A Significant Fair Value Gap

    The core of the current investment thesis for Trimble is a valuation discrepancy. Analysts place the fair value of the company at approximately $81.27, suggesting the stock may be significantly undervalued at its current price of $58.55. This estimation is rooted in fundamental expectations regarding margins and long-term growth, rather than fleeting market sentiment.

    Growth Drivers and Financial Outlook

    The bullish case for Trimble is built upon a transition toward recurring software revenue and an improved margin profile. The company’s specific earnings trajectory and the mix of its profitability metrics are central to the argument that the market has mispriced the stock. Investors looking to dig deeper into the company’s underlying narrative are encouraged to examine these growth projections against current valuation multiples.

    Risks to the Investment Thesis

    While the valuation gap presents an opportunity, it is not without risks. The narrative surrounding Trimble’s recovery could face headwinds if U.S. government spending remains stagnant or if increased competition from AI-driven firms exerts pressure on margins. These factors could potentially delay the company’s transition to a subscription-heavy business model, testing the confidence of current shareholders.

    As the August 12 earnings call approaches, the split in market opinion highlights the importance of thorough due diligence. Investors are advised to weigh the four key rewards against the identified warning signs before making a decision on whether to enter a position or wait for a deeper market pullback.

  • Energy Fuels Soars 10.3%: Betting Big on Rare Earths

    Energy Fuels Soars 10.3%: Betting Big on Rare Earths

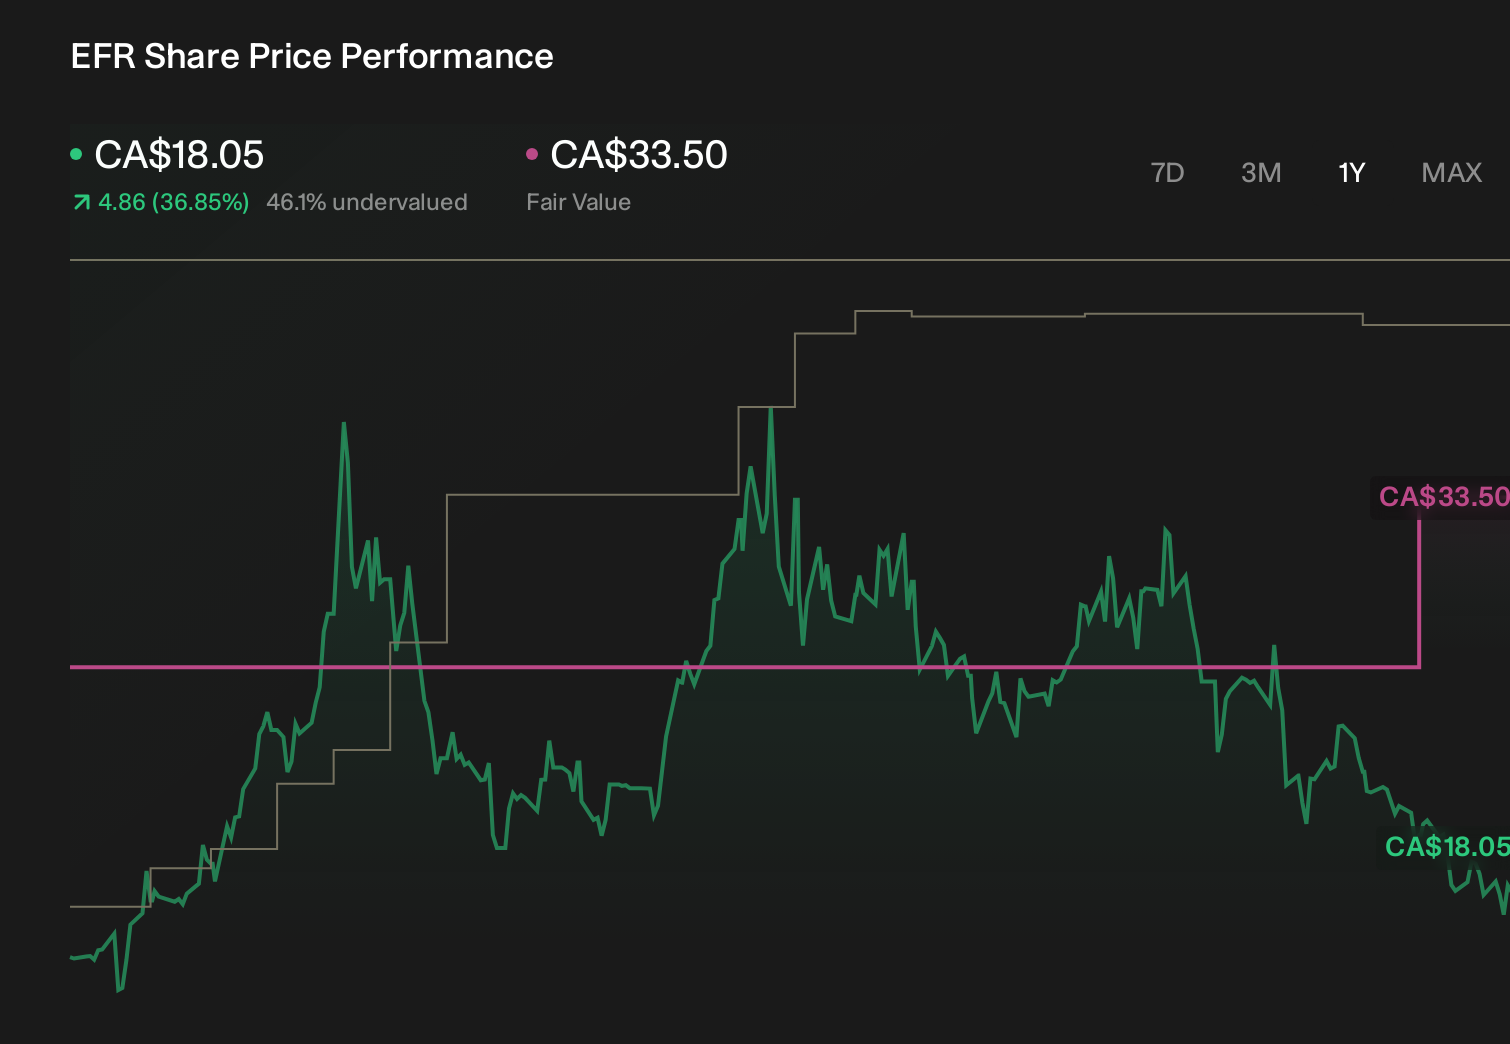
    Energy Fuels (TSX:EFR) shares surged 10.3% following the company’s latest quarterly report, which revealed rising revenues alongside widened losses as the firm doubles down on its high-stakes uranium and rare earth expansion strategy.

    The Balancing Act: Uranium vs. Rare Earths

    Investing in Energy Fuels currently requires a firm belief in the company’s ability to pivot its uranium and rare earth ambitions into long-term profitability. While management has reaffirmed its 2026 uranium production guidance, the path forward is marked by significant capital expenditure and execution risk. The immediate focus for investors remains the firm’s ability to meet production targets while successfully navigating the US$104 million expansion of the White Mesa facility.

    White Mesa: The Core of the Growth Strategy

    The construction phase for the heavy rare earth expansion at White Mesa marks a pivotal moment for the company. This project is the backbone of Energy Fuels’ “mine-to-magnet” vision, intended to secure high-margin revenue streams in the future. However, this expansion adds layers of financial risk to a business that is currently operating at a loss, making the funding and timeline of this project as critical as the company’s uranium ramp-up.

    Future Projections and Market Skepticism

    Energy Fuels is projecting a significant financial turnaround, forecasting $546.3 million in revenue and $194.8 million in earnings by 2029. Achieving these targets would require an aggressive 86.0% annual revenue growth rate and a swing from the current $70.2 million loss to a $265.0 million profit. These ambitious figures suggest a potential fair value of CA$41.12, implying a 128% upside from current price levels.

    Despite this optimism, market analysts remain divided. More conservative estimates suggest revenue closer to US$275.6 million with US$182 million in earnings by 2029. The latest quarterly results and the ongoing execution at White Mesa serve as key indicators that could force a reassessment of these divergent outlooks as the company maneuvers through its capital-intensive growth phase.

  • Humana Q2 2026: Margin Gains and Strategic Roadmap Ahead

    Humana Q2 2026: Margin Gains and Strategic Roadmap Ahead

    Humana (HUM) reported its second-quarter 2026 financial results on Wednesday, July 29, 2026, confirming that the company remains on track to meet its long-term financial commitments, including a sustainable 3% pretax margin by 2028. President and CEO Jim Rechtin emphasized that the firm’s current performance aligns with internal expectations, bolstered by significant progress in operational efficiency and clinical excellence.

    Navigating the Path to 2028

    Management underscored that the primary objective for 2027 Medicare Advantage (MA) bids is to secure margin progression. By adjusting plan designs and exiting underperforming markets, Humana aims to protect its high-value offerings. The company is preparing for a virtual investor update on December 10, where it will provide deeper insights into 2028 “Stars” bonus outcomes and 2027 membership projections.

    Operational Efficiency and Clinical Excellence

    Rechtin highlighted four core drivers of the business: product experience, clinical excellence, operational efficiency, and capital allocation. A major focus has been the centralization of operations, such as utilization management, which has already yielded hundreds of millions of dollars in savings in 2026. Furthermore, Humana is actively leveraging AI and automation to streamline workflows and reduce friction for both members and providers.

    Regarding “Stars” performance, Humana is moving away from the sole focus on the percentage of members in 4-plus star plans, shifting toward “Stars revenue per member per month” (PMPM). This metric is intended to better reflect competitive positioning in the marketplace. While the company maintains confidence in its operational progress, it remains subject to CMS threshold uncertainties.

    Capital Allocation and Market Expansion

    On the capital front, Humana is divesting noncore assets, including its minority interest in Gentiva, valued at approximately $900 million. These proceeds are largely earmarked to fund the recent acquisition of MaxHealth. Additionally, the company is set to enter the Illinois Medicaid market in January 2027, marking a significant expansion of its managed care footprint.

    The company also announced new additions to its Board of Directors: Paul Smith, Chief Commercial Officer at Anthropic, and Fred Crawford, a veteran financial executive with extensive experience in the insurance and banking sectors.

    Financial Performance and Cost Trends

    CFO Celeste Mellet reported that 2026 cost trends are currently tracking in the high single-digit range (7% to 8%), inclusive of medical and pharmacy costs. Notably, the company observed favorability in the inpatient space, particularly among members engaged with value-based care providers. The consolidated operating cost ratio saw a 120-basis-point improvement year-over-year, with a full-year target of 150 basis points.

    Addressing the 2027 bid strategy, Mellet noted that approximately 600,000 members will be impacted by planned market exits. However, the company intends to recapture a significant portion of this volume, similar to its strategy in 2025. Humana also pioneered a new contingent liquidity tool, utilizing $1.5 billion in pre-capitalized trust securities (P-Caps), to strengthen its balance sheet without increasing leverage.

    Looking Toward the Future

    During the Q&A session, leadership reiterated that value-based care remains a cornerstone of their medical cost management strategy. By aligning incentives between Humana and its provider partners, the company continues to see better health outcomes and lower cost trends compared to traditional fee-for-service models. As Humana approaches the December investor update, the firm remains committed to its existing strategy, focusing on sustainable growth and fulfilling the promises made to shareholders during its previous Investor Day.

  • Credit Card Stocks: Should You Pick Networks or Lenders?

    Credit Card Stocks: Should You Pick Networks or Lenders?

    Investors often group credit card companies into a single industry, yet the underlying business models for networks and lenders are vastly different. While consumers view the payment process as a seamless transaction, the distinct roles played by these financial entities dictate their long-term viability and risk profiles for any buy-and-hold portfolio.

    The Three Pillars of Digital Payments

    Every plastic card transaction relies on three distinct components to move money from the consumer to the merchant. The first is the hardware layer, where companies like Block (NYSE: XYZ) and Verifone provide the point-of-sale terminals. These businesses capture a small percentage of every transaction and often supplement revenue with subscription fees.

    At the opposite end of the spectrum are the card issuers, such as Bank of America (NYSE: BAC), Citigroup (NYSE: C), and JPMorgan Chase (NYSE: JPM). These institutions hold the consumer relationship and assume the primary risk associated with lending and potential defaults.

    The Vital Role of Payment Networks

    Bridging the gap between merchants and lenders are the payment network operators, most notably Visa (NYSE: V) and Mastercard (NYSE: MA). These companies act as the essential middlemen, managing the intricate communication between terminals and banks to ensure transaction approval. For this service, they collect a fraction of every dollar processed across their global networks.

    Some firms, like American Express (NYSE: AXP) and Capital One (NYSE: COF), occupy a hybrid space, operating as both payment networks and credit issuers, albeit on a smaller scale than the industry giants.

    Why Networks Often Win the Long-Term Bet

    When selecting a core holding for a portfolio, payment networks like Visa and Mastercard offer a compelling advantage over traditional lenders. While they may lack the aggressive growth potential of some credit issuers, they are insulated from the cyclical volatility of loan write-downs and credit defaults that plague banks during economic downturns.

    The financial consistency of these networks is striking. Aside from the unique disruption caused by the COVID-19 pandemic, neither Visa nor Mastercard has seen a decline in 12-month revenue or EBITDA over the past decade. This predictable performance is a hallmark of high-quality long-term investments.

    The Power of the Duopoly

    Beyond stability, Visa and Mastercard benefit from a powerful, entrenched duopoly that dominates the payment middleman sector. Their longevity allows them to continuously scale and integrate new profit centers, such as the customer engagement and merchant loyalty tools currently offered by Mastercard.

    While hybrid players like American Express and Capital One (through its Discover arm) maintain a presence in the network space, the massive infrastructure and brand penetration of Visa and Mastercard create a significant barrier to entry, keeping them well-positioned for sustained growth.