
Categoria: news

  • Planet Fitness Q2 Growth: Revenue Hits $365M Amid Rebranding

    Planet Fitness Q2 Growth: Revenue Hits $365M Amid Rebranding

    Planet Fitness (NYSE:PLNT) posted a 7% revenue increase to $365 million in the second quarter, up from $341 million year-over-year, as the company aggressively pivots its marketing and pricing strategies to accelerate membership growth.

    Financial Performance and Membership Metrics

    System-wide same-club sales saw a 1.7% uptick, a gain CFO Sudhanshu Priyadarshi attributed entirely to rate growth. The gym chain concluded the quarter with 21.5 million members, a 3.6% increase compared to the previous year. Notably, Black Card penetration climbed to 68%, reflecting a 210 basis point improvement. While net income reached $67 million, adjusted EBITDA rose 3.5% to $153 million, despite a slight contraction in adjusted EBITDA margin to 41.8%.

    Strategic Growth and Franchise Expansion

    The franchise segment led the charge with a 13% revenue boost, supported by higher royalty fees and increased national advertising fund contributions—which the company plans to raise from 2% to 3% by 2026. Corporate-owned club revenue also grew by 4%. During the quarter, Planet Fitness opened 23 new locations, including five international sites, and remains on track to hit its goal of 180 to 190 new openings throughout 2026.

    Capital Allocation and Share Repurchases

    Planet Fitness demonstrated confidence in its valuation by repurchasing 4 million shares for $200 million during the quarter. With $250 million spent year-to-date, the company still holds $250 million in authorized buyback capacity. To fund these maneuvers, the firm utilized cash on hand and a $75 million drawdown on a variable funding note, which management intends to repay by the end of the year.

    Rebranding: A Pivot Toward Approachability

    CEO Colleen Keating is spearheading a mission to capture the 70% of the U.S. population currently not paying for a gym membership. The company is refining its advertising creative to move away from intense “sweat-heavy” imagery, opting instead for a more lighthearted, welcoming aesthetic. “We want to ensure our brand approachability is clear to all potential members,” Keating noted, adding that extensive consumer testing is underway to shape future campaigns.

    Pricing Tests and Digital Innovation

    In a move to gauge price elasticity, Planet Fitness will launch a limited-time national promotion offering the Classic Card at $10. Management emphasized this is a strategic test rather than a permanent price rollback. On the tech front, the company is deploying an AI-driven churn model to identify at-risk members and is set to roll out a redesigned app in September. This update will feature personalized home screens, enhanced activity tracking, and improved accuracy for the brand’s signature “Crowd Meter.”

    Updated 2026 Outlook

    Reflecting the impact of its share repurchase program, Planet Fitness raised its adjusted earnings per diluted share growth outlook to approximately 6%. While higher interest expenses—tied to the variable funding note—have slightly adjusted net income expectations, the company maintains its broader guidance, including a 7% total revenue growth target and 6% adjusted EBITDA growth for the fiscal year.

  • Texas Home Insurance Costs Are Skyrocketing: Is Ownership Over?

    Texas Home Insurance Costs Are Skyrocketing: Is Ownership Over?

    A joint study by the Kinder Institute and Texas 2036 reveals that soaring homeowners’ insurance premiums are creating a significant barrier to homeownership across Texas, with some rates surging by 74% since 2009.

    The Growing Burden on Household Budgets

    Experts highlight that insurance premiums now claim a substantially larger share of family budgets compared to a decade ago. This financial strain is not isolated to metropolitan areas; it is a systemic challenge affecting homeowners in every corner of the state.

    Stephen Sherman, a researcher at Rice University’s Kinder Institute, emphasizes that the issue extends beyond the sticker price of a property. “We need to look beyond the cost of the home. We need to look at the other necessary expenses of homeownership, insurance being a big one—taxes, maintenance, repairs—but we also need to look at incomes,” Sherman stated.

    Outpacing Income and Home Values

    Data indicates that insurance rates have escalated at a much sharper trajectory than both local incomes and property values. This disconnect is making the dream of homeownership increasingly unattainable for a vast segment of the population.

    According to the findings, two-thirds of Texas households are currently priced out of median-priced homes once insurance requirements are factored into the equation. For context, the Houston Association of Realtors reported the median home price in Houston reached $345,000 in June.

    The Cost of Protection

    Homeowners’ insurance now averages approximately $3,000 annually, a figure that fluctuates based on geographic location and notably excludes additional costs like flood insurance. The study links these premium spikes to a combination of catastrophic weather events and rising structural cost pressures.

    What Lies Ahead for Texas Homeowners?

    Researchers have identified that rural counties are experiencing disproportionately higher insurance burdens when measured against their respective home values. As the crisis deepens, the next phase of the study will investigate how families are forced to adjust their household budgets to accommodate these rising costs.

  • Travel + Leisure CTO Sells Shares After 30% Rally: Red Flag?

    Travel + Leisure CTO Sells Shares After 30% Rally: Red Flag?

    Sy Esfahani, Chief Technology Officer of Travel + Leisure Co. (NYSE:TNL), offloaded 52,617 shares of company stock on August 4, according to a recent SEC Form 4 filing.

    The Transaction Details

    The sale was executed at a weighted average price of $78.00 per share. Based on the market close on August 4, which saw the stock finish at $78.06, the timing of the transaction follows a significant 30% rally in the company’s share price, prompting investors to evaluate whether this insider move signals a shift in sentiment for the hospitality giant.

    Understanding Travel + Leisure’s Market Position

    Travel + Leisure Co. remains a formidable force in the global hospitality industry, currently commanding a market capitalization of $4.7 billion. With trailing-twelve-month (TTM) revenue reaching $4.1 billion, the company has cemented itself as a major leader in both the vacation ownership and travel services sectors.

    The firm operates under a diversified business model designed to maximize recurring revenue. By integrating fractional ownership sales, consumer financing, and membership-based travel services, Travel + Leisure captures value throughout the entire customer lifecycle. Its extensive portfolio of vacation properties and integrated service platform provide a distinct competitive advantage, allowing the company to maintain a steady footprint across the global travel experience spectrum.

  • Life360 Q2 Earnings: Growth and Freemium Strategy Revealed

    Life360 Q2 Earnings: Growth and Freemium Strategy Revealed

    Life360 Q2 Earnings Overview

    Life360 reported its second-quarter financial performance, underscoring the ongoing success of its freemium business model in the location-sharing technology market.

    Understanding the Freemium Business Model

    The core of Life360’s operational strategy centers on a tiered freemium model. This approach allows the company to capture a broad user base by offering a robust no-cost tier, which includes essential location-sharing capabilities and real-time safety alerts.

    Market Positioning and User Engagement

    By providing high-value features for free, Life360 effectively lowers the barrier to entry for new users. This strategy not only drives platform adoption but also creates a significant pipeline for converting free users into premium subscribers. The Q2 earnings call highlighted how this balance between accessibility and monetization continues to be the primary engine for the company’s growth in the competitive tech space.

  • BlackSky Q2 Revenue Soars 50% on Gen-3 Satellite Demand

    BlackSky Q2 Revenue Soars 50% on Gen-3 Satellite Demand

    BlackSky Technology (NYSE:BKSY) reported a 50% year-over-year revenue surge in the second quarter of 2026, fueled by the rapid adoption of its Gen-3 satellite imagery services, which propelled the company to positive adjusted EBITDA and a reaffirmed full-year outlook.

    Financial Performance and Operational Growth

    Total revenue for the quarter reached $33.3 million, marking a 60% sequential increase from the first quarter. CFO Henry Dubois highlighted that space-based intelligence and AI services were the primary catalysts, generating a record $24.5 million—a 50% sequential jump driven by robust recurring subscription revenue and surging international demand.

    The company achieved an adjusted EBITDA of $4.7 million, a significant $7.5 million improvement over the same period last year, representing an adjusted EBITDA margin of 14.2%. Notably, cash operating expenses remained flat despite the substantial 50% revenue growth.

    The Gen-3 Advantage

    CEO Brian O’Toole identified BlackSky’s Gen-3 satellites, which deliver high-resolution 35-centimeter imagery, as the engine of the company’s expansion. These products and services accounted for 90% of the growth observed during the quarter. With the company reaching a $100 million annual run rate for imagery and AI subscriptions, O’Toole noted that the high-margin subscription model is successfully generating operating leverage.

    International Expansion and Sovereign Demand

    International revenue has become a critical pillar for BlackSky, rising 200% compared to the previous year, while international space-based intelligence and AI services grew by 150%. Currently, multi-year international subscription contracts comprise over 80% of the company’s funded backlog. O’Toole emphasized that the quarterly revenue increase was driven entirely by subscription growth rather than one-time transactions, with existing clients increasingly tasking more work toward Gen-3 services.

    Strategic Infrastructure and AROS Development

    BlackSky plans to launch two additional satellites in the third quarter, aiming for a total of eight Gen-3 satellites in orbit by the end of 2026. Looking further ahead, the company has over 20 Gen-3 satellites in its pipeline to support its commercial constellation and sovereign customer inventory. By maintaining available inventory, BlackSky expects to deliver systems within roughly one year of order—a sharp contrast to the three-to-five-year lead times common among competitors.

    In a major development, BlackSky secured an eight-figure contract from the U.S. National Reconnaissance Office (NRO) to advance its AROS system for foundation mapping. Advanced Technology Program revenue climbed 65% sequentially as work on this project commenced. The company is designing a unified AROS configuration to serve both government and commercial needs, keeping the strategy capital-expenditure light.

    Liquidity and Future Outlook

    The company finished the quarter in a strong liquidity position with $244.1 million in cash, up more than 150% year-over-year. Following an at-the-market offering that raised $150 million, total liquidity now exceeds $325 million. With capital expenditures totaling $31 million through the first half of the year, management remains confident in its 2026 guidance, expecting growth across all three business lines: space-based intelligence, Mission Solutions, and Advanced Technology Programs.

  • China Dominates Humanoid Robot Market: Why It’s Not Over Yet

    China Dominates Humanoid Robot Market: Why It’s Not Over Yet

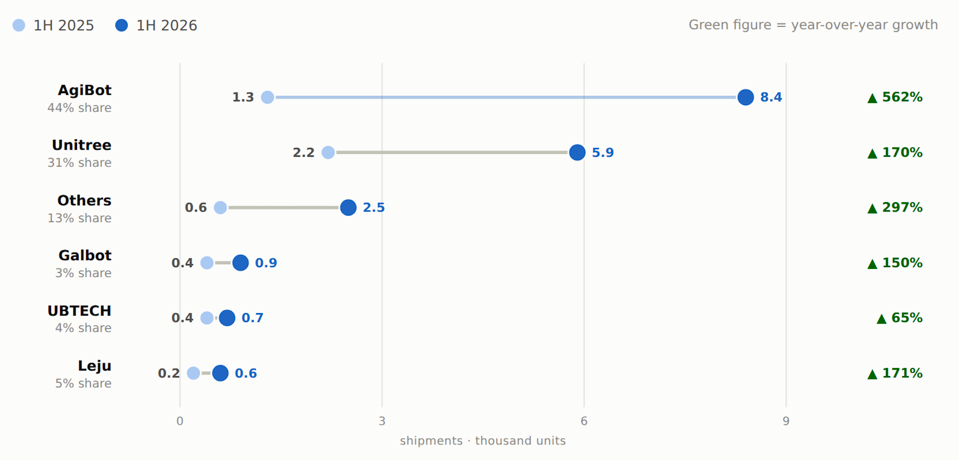
    Global humanoid robot shipments surged 272% year-over-year in the first half of 2026, reaching 19,100 units, according to a report by Smart Analytics Global. With projections hitting 60,000 units by year-end and a target of half a million by 2030, the industry is scaling rapidly, yet Chinese manufacturers currently control 97% of global shipments and 85% of total demand.

    The Rise of Chinese Market Leaders

    The market landscape has shifted dramatically, with Shanghai-based startup AgiBot emerging as the new frontrunner. AgiBot shipped 8,400 units in the first half of 2026—capturing 44% of the global market—marking a massive 562% increase from the previous year. This performance pushed AgiBot ahead of former leader Unitree, which secured a 31% market share with 5,900 units. Together, these two firms now dominate three-quarters of the global humanoid robot population.

    While Unitree has focused on its popular, compact G1 model for research and viral media, AgiBot has pursued a diversified strategy. Its lineup includes full-size bipedal A-series robots, X-series units, and wheeled G-series models designed specifically for industrial and warehouse environments. AgiBot is already expanding into the U.K. and Germany, though its potential U.S. expansion remains stalled due to regulatory hurdles.

    From Viral Demos to Industrial Utility

    A critical trend highlighted by Smart Analytics Global is the transition from novelty to utility. Industrial and commercial applications now account for over 70% of shipments, up from 50% just a year ago. As these robots move into assembly lines and logistics hubs, market revenue is expected to climb from $1.6 billion in 2026 to $3 billion in 2027.

    The U.S. Regulatory Response

    In late July, the Federal Communications Commission (FCC) issued a ban on new imports of foreign-made humanoid and quadruped robots, citing national security and cybersecurity risks. By specifically naming Unitree and AgiBot, the U.S. government is attempting to curb the integration of foreign-controlled hardware—equipped with cameras and sensors—into American infrastructure. While this ban does not affect existing units, it creates a significant barrier for future Chinese market entry in the United States.

    Why the Sales Gap Isn’t a Technology Gap

    Despite China’s overwhelming lead in current shipment volume, the dominance of Chinese firms does not necessarily signal a defeat for American and European innovation. U.S. companies like Figure, Boston Dynamics, Agility Robotics, Apptronik, and 1X are prioritizing product reliability and technical capability over raw volume.

    Scaling too early carries the risk of flooding the market with unreliable machines, which can erode brand trust and waste capital. American and European developers appear to be pursuing a “Goldilocks” strategy: waiting until their robots can perform complex, economically viable tasks before initiating mass production. While China currently holds an advantage in deployment data, the race to build the most capable humanoid robot remains highly competitive, and the FCC’s recent actions provide domestic manufacturers with additional time to refine their technology and prepare for large-scale deployment.

  • Becton Dickinson (BDX) Jumps 6.8% After Strong Q3 Earnings

    Becton Dickinson (BDX) Jumps 6.8% After Strong Q3 Earnings

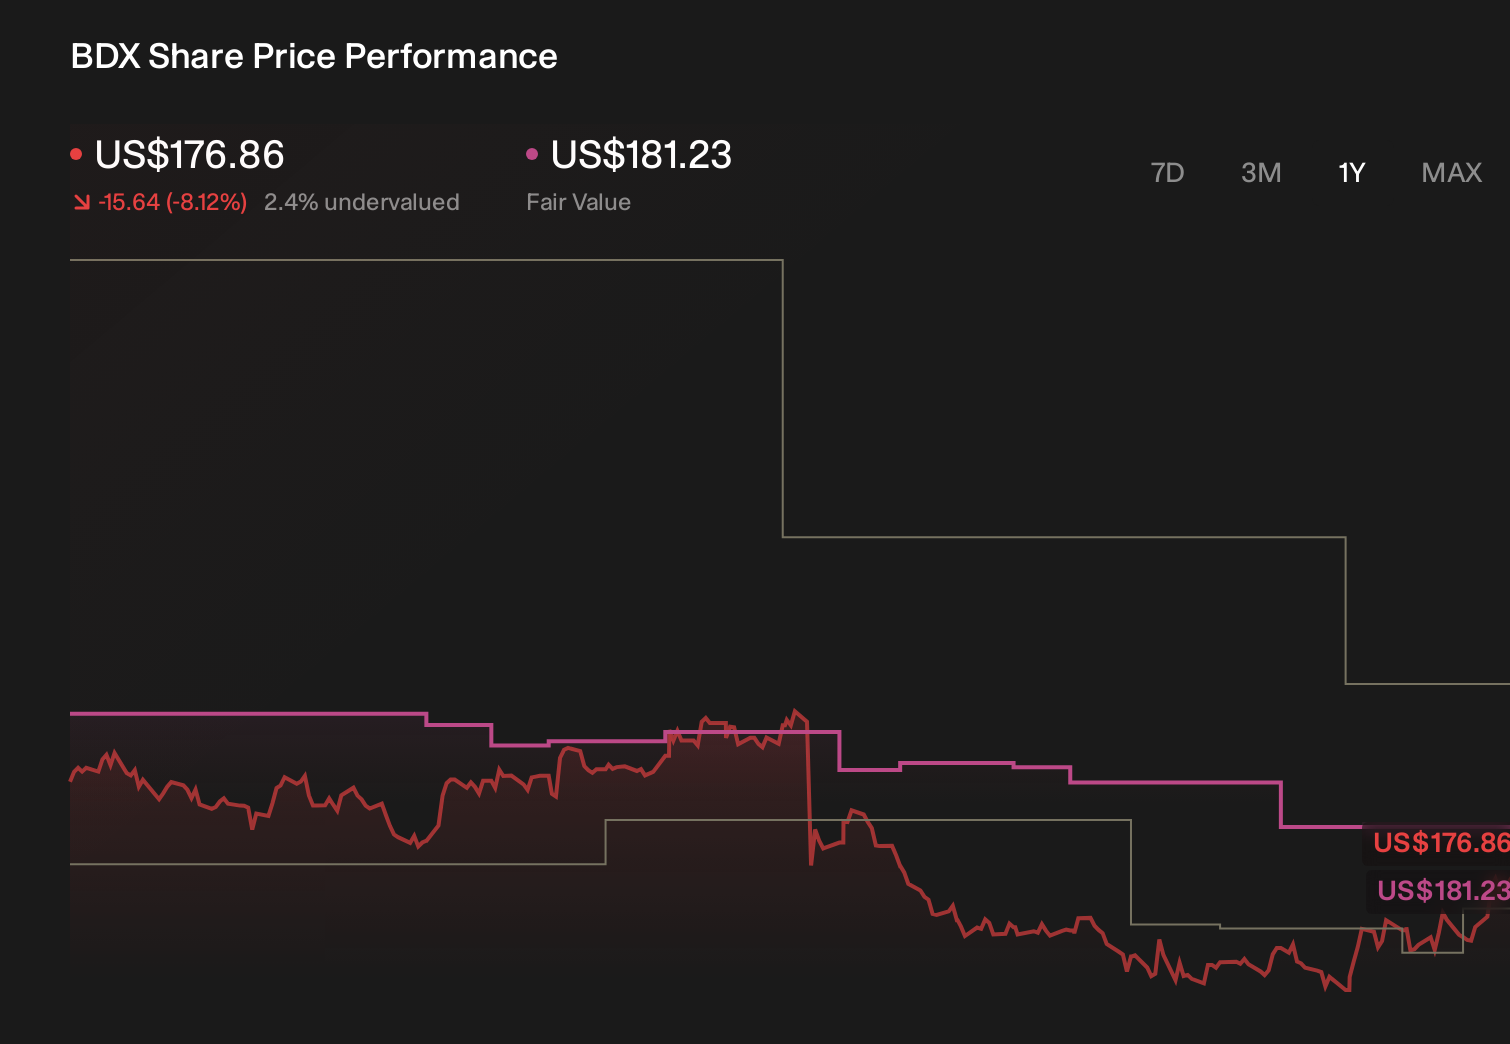
    Becton Dickinson (BDX) shares climbed 6.8% following a strong third-quarter performance, driven by better-than-expected revenue growth and strategic partnerships in the GLP-1 drug delivery market.

    Q3 Performance and Strategic Growth

    Investing in Becton Dickinson requires confidence in a medical technology franchise that prioritizes innovation to drive incremental revenue, improve margins, and sustain reliable dividend payouts. The latest quarterly results reinforce this thesis, as FX-neutral revenue outperformed analyst expectations. Management has subsequently raised its full-year outlook, buoyed by significant momentum in biologic drug delivery and new GLP-1 partnerships, including a notable semaglutide pen agreement in Brazil.

    Earnings Quality and Operational Focus

    Despite the positive growth trajectory, investors remain attentive to earnings quality. A sharp decline in year-to-date net income and a substantial one-off loss highlight the critical need for rigorous cost control in the near term. While the company maintained its annual dividend of US$4.20 and the share price has shown signs of recovery, the market’s focus has shifted toward the company’s balance sheet strength and cash generation capabilities.

    Valuation and Market Outlook

    Cash flow management and debt coverage remain key metrics for stakeholders to monitor. While Becton Dickinson’s shares have trended upward, some analysts suggest the stock remains undervalued by as much as 25%.

    Analyzing Fair Value Estimates

    Fair value estimates for BDX currently range between US$189.58 and US$234.52, reflecting a broad spectrum of market opinion. This variance, coupled with recent earnings volatility and one-off charges, underscores the importance for investors to synthesize multiple perspectives before establishing a position on the company’s current risk-reward profile.

  • Bunge Q2 2026 Earnings: Profit Soars Amid Global Volatility

    Bunge Q2 2026 Earnings: Profit Soars Amid Global Volatility

    Bunge Global (BG) reported a robust second quarter for 2026, with adjusted earnings per share (EPS) reaching $2.00, significantly outperforming the $1.31 recorded in the same period last year. During the earnings call held on Wednesday, July 29, 2026, CEO Greg Heckman attributed the strong performance to the company’s diversified global platform and disciplined risk management in an increasingly complex macroeconomic environment.

    Navigating Global Complexity

    The company’s ability to thrive despite geopolitical tensions, shifting trade flows, and volatile weather patterns was a central theme of the discussion. Heckman highlighted that Bunge’s integrated value chain allows it to capture opportunities that smaller, less diversified competitors might miss. “Bunge’s business is built for complexity and change,” Heckman stated, noting that the organization’s expanded footprint—bolstered by the Viterra transaction—has provided essential optionality in managing supply chain disruptions.

    Financial Highlights and Segment Performance

    John Neppl, Chief Financial Officer, provided a detailed breakdown of the segment results, which saw a surge in adjusted EBIT to $796 million, compared to $373 million in the prior year. Key drivers included:

    • Soybean Processing and Refining: Strong results in North and South America, particularly in Argentina, drove performance.
    • Softseed Processing: Execution across all regions improved, reflecting greater production capacity in Canada, Argentina, and Europe.
    • Grain Merchandising: Success in ocean freight and commercial services helped offset lower results in global grain merchandising and sugar.

    Strategic Outlook and Capital Allocation

    Reflecting confidence in its operational momentum, Bunge raised its full-year 2026 adjusted EPS guidance to a range of $9.25 to $9.75, up from the previous $9.00 to $9.50. The company remains focused on its capital allocation strategy, having completed a $2 billion share repurchase program associated with the Viterra integration. Furthermore, Bunge continues to invest in high-growth areas, including renewable fuels. Recent partnerships with Acelen, Petrobras, and Vibra in Brazil underscore the company’s commitment to providing sustainable soybean oil feedstock for Sustainable Aviation Fuel (SAF) and renewable diesel production.

    Operational Milestones and Future Growth

    Bunge’s management provided updates on several key capital projects, which are expected to bolster earnings power through 2030:

    • Destrehan, Louisiana: A new barge unloader and multi-seed processing plant are nearing completion, expected to be operational in the coming months.
    • Morristown SPC Plant: The facility is currently producing product, with ramp-up expected to continue as customer qualification progresses.
    • Westhaven, Netherlands: The large specialty and refined oils project remains on track for completion by the end of Q1 2027.

    Heckman emphasized that the long-term demand drivers, such as population growth and the rising need for food, feed, and fuel, remain “durable multiyear tailwinds.” As Bunge moves into the second half of 2026, the company remains positioned to leverage its expanded network and commercial synergies to maintain its competitive edge in the global agricultural market.

  • TaskUs Stock Fair Value Slashed 12% Amid Q2 Analyst Review

    TaskUs Stock Fair Value Slashed 12% Amid Q2 Analyst Review

    TaskUs (TASK) faces a downward revision in market expectations as analysts cut the stock’s fair value estimate from US$9.50 to approximately US$8.33—a 12% decrease following the latest second-quarter performance analysis.

    Evaluating the TaskUs Valuation Shift

    The revised fair value reflects a complex landscape for TaskUs. While analysts remain optimistic regarding the company’s operational execution, this sentiment is tempered by growing caution surrounding client concentration risks and broader sector multiples. These moving components are currently being recalibrated by market observers to better align with the firm’s evolving financial narrative.

    Understanding Financial Narratives and Risk

    Market narratives serve as a bridge between a company’s operational story and the underlying financial assumptions used to determine fair value. As new data emerges, these assumptions are adjusted, providing investors with a clearer picture of how specific catalysts and operational risks directly impact the valuation models employed by analysts.

    For investors monitoring the situation, it is critical to look beyond standard price targets. Analyzing how specific business risks—such as the one currently flagged for TaskUs—interact with sector-wide trends is essential for understanding the company’s long-term trajectory.

    Monitoring the Evolving Outlook

    The adjustment to the fair value estimate underscores the importance of staying informed on how shifting market conditions influence company-specific data. By tracking these metrics, stakeholders can better identify how the interplay between internal execution and external market pressures shapes the investment thesis for TaskUs moving forward.

  • ATI Raises Guidance as Record Backlog Defies Valuation Fears

    ATI Raises Guidance as Record Backlog Defies Valuation Fears

    ATI (ATI) posted strong second-quarter financial results on August 6, 2026, featuring year-over-year growth in both sales and earnings, alongside an upward revision in full-year guidance fueled by a record-breaking contracted backlog.

    Market Momentum and Investor Sentiment

    The company’s robust quarterly performance has triggered significant share price momentum. ATI recorded a 1.97% gain in a single day and a 21.55% surge over the last seven days. These gains contribute to a 90-day return of 43.85% and a year-to-date increase of 91.14%. This long-term shareholder value reflects growing investor confidence in the company’s strategic backlog, improved financial outlook, and active share buyback programs.

    Valuation vs. Growth Narrative

    Following the rapid appreciation of ATI’s stock, investors are now questioning whether the current valuation reflects the company’s full potential or if the market has moved ahead of the fundamentals. With the stock recently closing at $227.84, it currently trades above the widely accepted fair value estimate of $200.33, which is derived from detailed earnings and margin projections utilizing a 7.9% discount rate.

    The Future Growth Path

    The core investment narrative for ATI rests on compounding growth within the high-value aerospace and defense sectors. This strategy assumes rising profitability and an earnings multiple that, while currently elevated, is expected to compress over time. The realization of this $200.33 fair value remains tethered to specific revenue mix assumptions and sustained cash flow performance.

    Key Operational Risks

    Despite the optimism, ATI faces distinct challenges. The company maintains a heavy reliance on a select group of major aerospace customers. Furthermore, the necessity for ongoing high capital expenditure could pressure margins if project costs escalate or if future order volumes fail to meet aggressive growth expectations. These factors remain the primary variables that could disrupt the current bullish sentiment surrounding the stock.