
Blog

  • Occidental Petroleum Eyes $4B Cash Flow Boost by 2030

    Occidental Petroleum Eyes $4B Cash Flow Boost by 2030

    Occidental Petroleum (OXY) leadership, led by CEO Richard Jackson and CFO Sunil Mathew, confirmed a strategic roadmap during their Q2 2026 earnings call to deliver $4 billion in sustainable free cash flow improvements by 2030. This growth is anchored in structural operational efficiencies, debt reduction, and a disciplined capital allocation strategy that prioritizes preferred equity redemption over share buybacks.

    The Path to $4 Billion in Cash Flow

    The company’s plan is front-loaded to ensure momentum, with roughly $2 billion—or 50% of the target—slated for achievement between 2026 and 2027. Key drivers include the completion of Stratos capital expenditures, significant interest expense savings from aggressive debt reduction, and ongoing gains in operational productivity. The remaining balance, including the $700 million preferred equity redemption, is projected for completion by 2029.

    Capital Spending and Efficiency Targets

    CFO Sunil Mathew detailed that the 2027 capital spending baseline is set at $5.9 billion, which includes mid-cycle projects. When excluding exploration and multiyear ventures like the Gulf of America waterflood, sustaining capital is estimated at $5.0–$5.1 billion. The objective is to drive this sustaining capital down to $4.5 billion by 2030 by lowering the base decline rate from approximately 25% to 20% and improving well cost efficiency by 12%.

    Advancing Recovery Through CO2 EOR

    CEO Richard Jackson emphasized that Occidental’s decade-long investment in CO2 Enhanced Oil Recovery (EOR) pilots in the Permian is yielding results, with consistent recovery uplifts exceeding 45%. These techniques are expected to boost unconventional recovery factors from 10% toward 20%. Three commercial projects are currently in development, with an expected online window between late 2028 and 2029, further supporting the company’s base decline rate targets.

    Debt Reduction and Shareholder Returns

    Management clarified that debt reduction remains the immediate financial priority. The company aims to reach a $10 billion principal debt milestone before pivoting to further net debt reduction and accumulating cash for the August 2029 preferred equity redemption. Consequently, share buybacks are currently classified as a lower priority until the preferred equity obligations are fully satisfied.

    Operational Excellence and Low Carbon Ventures

    Occidental continues to lean into a “doing more with less” philosophy. Despite reducing rig counts in the Permian, the company expects to bring 15 additional wells online, bolstered by advanced drilling efficiencies and simulfrac operations. Regarding Low Carbon Ventures (LCV), the company views carbon capture as a value-add, particularly for powering data centers and managing EOR operating costs. With the Stratos project transitioning from development to operations, approximately $400 million in LCV capital is expected to roll off starting next year.

    Midstream Outlook and Growth Strategy

    While new Permian takeaway capacity is narrowing Waha to Gulf Coast spreads—impacting midstream income—the company noted this is being offset by stronger upstream gas realizations. Consequently, Occidental has increased its full-year midstream guidance by $300 million. Looking toward 2027 and beyond, management is evaluating an “efficiency-led growth” model, where a moderate 2% CAGR could potentially exceed the $4 billion free cash flow baseline by 2030, provided that short-cycle and mid-cycle investments remain balanced.

  • Cimpress Q4 2026: Canva Partnership and Growth Targets

    Cimpress Q4 2026: Canva Partnership and Growth Targets

    Cimpress (CMPR) concluded its fiscal year 2026 with a strategic focus on operational excellence, announcing a major partnership with design giant Canva and raising its profitability targets for 2028 during its Q4 earnings call. Founder and CEO Robert Keane and CFO Sean Quinn detailed how the company’s ongoing transformation—centered on mass customization and supply chain efficiency—positions it for sustained growth despite a complex global trade environment.

    Strategic Partnership: Integrating with Canva

    A centerpiece of the company’s forward-looking strategy is a new technical integration with Canva. According to Robert Keane, this partnership allows customers to move seamlessly from design prompts to professionally produced Vistaprint products without leaving the Canva platform. “Canva is a real leader in Artificial Intelligence, and Canva AI will plug directly into Cimpress systems,” Keane noted. The integration is currently live for Vistaprint products in the U.S. and Canada, with plans for a global rollout across 25 additional countries by the end of September.

    Fiscal 2026 Performance and Financial Outlook

    Cimpress reported full-year revenue of $3.74 billion, a 10% increase on a reported basis. Adjusted EBITDA for the year reached $458.5 million. While Q4 profitability was impacted by approximately $10 million in non-core costs—including start-up expenses for North American manufacturing and inventory write-downs—management emphasized that these factors do not alter the company’s long-term trajectory.

    For fiscal 2027, the company provided the following guidance:

    • Revenue Growth: At least 7% (3% organic constant currency).
    • Adjusted EBITDA: At least $520 million, representing over 13% year-over-year growth.
    • Adjusted Free Cash Flow: Approximately $200 million.

    Raising the Bar for 2028

    Bolstered by recent tuck-in acquisitions, including the purchase of Saxoprint, Cimpress has raised its fiscal 2028 financial targets. The company now expects adjusted EBITDA of at least $615 million, up from its previous guidance of $600 million. Keane reiterated that the primary objective remains intrinsic value per share, rather than chasing short-term EBITDA targets at the expense of long-term health.

    Navigating Trade and Competitive Landscapes

    CFO Sean Quinn addressed the dynamic tariff environment, noting that while new U.S. Section 338 tariffs on Canadian goods present challenges, the company is actively operationalizing supply chain adjustments to mitigate the impact. Regarding the broader market, Keane maintained that the competitive landscape remains consistent with historical trends. “We live in a very, very competitive world, but that’s healthy,” he stated, noting that Cimpress’s scale and ability to serve small-to-medium customers provide a distinct advantage over larger industry players that focus primarily on enterprise-level clients.

    Operational Focus and Future Investments

    Looking beyond 2028, management expressed confidence in the company’s ability to continue growing cash flow. The focus remains on “elevated products” and expanding wallet share among high-value customers. By leveraging AI to drive development efficiency and maintaining disciplined capital allocation, Cimpress aims to sustain its multi-decade disruption of the fragmented $100 billion customized marketing products market.

  • Fed’s New Inflation Forecast Sparks September Rate Debate

    Fed’s New Inflation Forecast Sparks September Rate Debate

    The Federal Open Market Committee (FOMC) faces a critical turning point for its September meeting as new inflation data and a divided committee signal potential volatility ahead. With three members already dissenting in favor of a rate hike during the July meeting and Chair Kevin Warsh offering conflicting messaging, market uncertainty is at an all-time high.

    Market Uncertainty and the FedWatch Tool

    According to the CME Group’s FedWatch tool, current market sentiment is split almost down the middle. As of August 6, there is a 55% probability of a quarter-point rate hike, contrasted with a 45% chance that the Fed will maintain the status quo. This equilibrium underscores the extreme importance of upcoming employment and inflation reports over the next six weeks.

    The Role of Inflation Nowcasting

    To navigate this uncertainty, investors are increasingly turning to the Federal Reserve Bank of Cleveland’s “Inflation Nowcasting.” These real-time estimates provide a vital look at inflation gauges for the current and upcoming months, helping to bridge the gap between official Bureau of Labor Statistics (BLS) reports.

    The Post-Pandemic Inflation Struggle

    Inflation has remained a persistent challenge since the COVID-19 pandemic. After the aggressive price surges of 2022 forced the FOMC into a series of jumbo rate hikes, progress has been made, yet the Fed’s preferred 2% target remains elusive. Economists continue to debate the impact of broader economic factors, including high tariff rates and geopolitical tensions, on the current price environment.

    Examining July and August Projections

    The BLS is scheduled to release July CPI data on August 12. Expectations suggest a 0.09% monthly rise and a 3.42% year-over-year increase. More importantly, Core CPI—which excludes volatile food and energy costs—is projected to rise 0.21% for the month and 2.52% annually. Meanwhile, Core PCE, the Fed’s primary inflation benchmark, is expected to show a slight uptick of nearly 0.3% for July.

    A Collision Course for the September Meeting

    The FOMC is set to meet on September 15-16. While members will have access to the August CPI report, the August PCE data will not be available until after the session concludes. The current Nowcasting estimates suggest a potential reacceleration of core CPI growth, a factor that could embolden hawkish members who are already pushing for tighter policy.

    Hawks vs. Doves: The Impending Split

    The data creates a classic dilemma for the committee. Hawks may view the projected 0.2% monthly core growth as a sign that inflation is heating up, justifying further rate hikes. Conversely, doves may interpret the same data as a softening trend compared to previous highs, arguing for patience. As the committee remains deeply divided, the upcoming economic reports are set to define the tone for one of the most anticipated FOMC meetings of the year.

  • Is Jackson Financial (JXN) Overvalued After Q2 Earnings?

    Is Jackson Financial (JXN) Overvalued After Q2 Earnings?

    Jackson Financial (JXN) reported robust Q2 2026 financial results, posting US$168 million in revenue and US$655 million in net income, marking a significant year-over-year increase in earnings per share from continuing operations.

    Market Momentum and Shareholder Returns

    The company’s stock has demonstrated strong performance, yielding a year-to-date return of 20.94%. Over the past three years, Jackson Financial has delivered a total shareholder return of approximately 3x, a trend largely fueled by consistent earnings growth, dividends, and aggressive share buyback programs.

    Valuation vs. Intrinsic Estimates

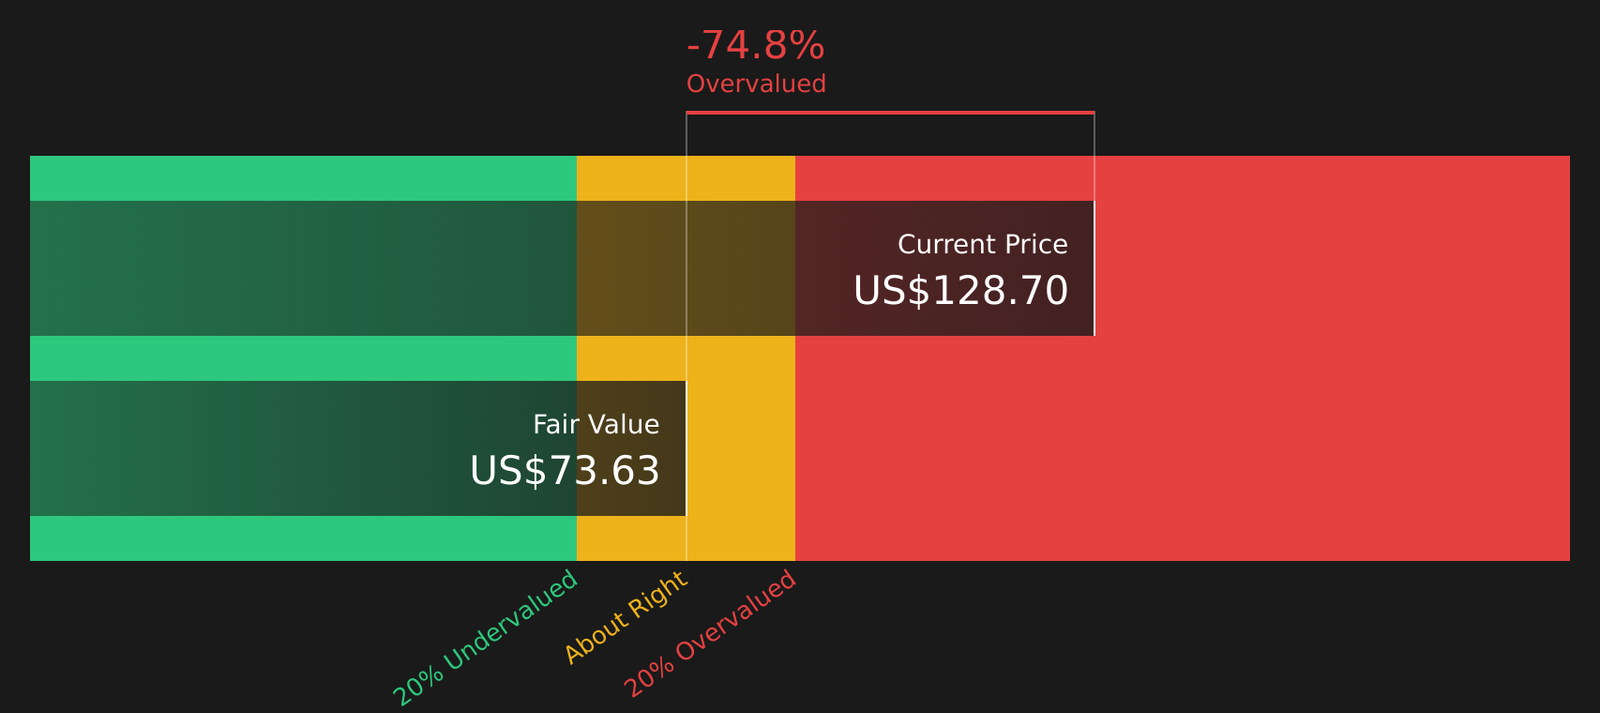
    Following the recent rally, JXN shares are trading at $129.96, which sits slightly above the narrative fair value estimate of $118. This discrepancy forces investors to look closer at the underlying assumptions regarding future growth, margins, and earnings trajectories.

    The Narrative Behind the Valuation

    The current fair value assessment of $118 is predicated on a specific revenue glide path, a anticipated shift in margins, and a tighter valuation multiple. Analysts are utilizing a discounted cash flow model with an 8.29% hurdle rate to determine if the company’s projected earnings acceleration can bridge the gap between its current market price and its intrinsic value.

    Growth Catalysts and Risk Factors

    Despite the valuation premium, Jackson Financial could outperform expectations if retail annuity sales maintain their current momentum. Furthermore, continued share buybacks remain a critical lever for reducing share count and bolstering per-share value.

    Investors should weigh these potential rewards against the inherent risks in the current narrative. A balanced perspective requires testing the assumptions behind the company’s growth forecasts and monitoring the key indicators that could impact long-term performance.

  • Johnson & Johnson: What OTTAVA and Talc Deals Mean for JNJ

    Johnson & Johnson: What OTTAVA and Talc Deals Mean for JNJ

    Johnson & Johnson (JNJ) is betting its future on a pivot toward innovative medicine and MedTech, anchored by the recent FDA authorization of the OTTAVA robotic surgery system and a proposed US$5.50 billion talc litigation settlement aimed at curbing long-term financial uncertainty.

    The Shift Toward MedTech and Robotics

    The FDA De Novo authorization for the OTTAVA robotic surgery system marks a pivotal entry for Johnson & Johnson into the soft tissue robotics market. This development is a core component of the company’s broader MedTech strategy, which is being bolstered by strategic partnerships in electrophysiology. While the OTTAVA system is currently in its early stages, its commercial trajectory—coupled with the Priority Review status of oncology assets like RYBREVANT FASPRO—serves as a critical litmus test for J&J’s innovation agenda. The company is under pressure to prove that these new assets can successfully offset the revenue impact as legacy products face increasing competition from biosimilars.

    Navigating Litigation and Financial Targets

    Beyond product innovation, the largest overhang for shareholders remains the ongoing talc litigation. The proposed US$5.50 billion settlement framework is a significant milestone, as it seeks to provide a clearer path forward by reducing the unpredictability of future cash demands. Investors are closely monitoring how these liabilities influence the company’s capital allocation and overall balance sheet health.

    Growth Projections and Market Sentiment

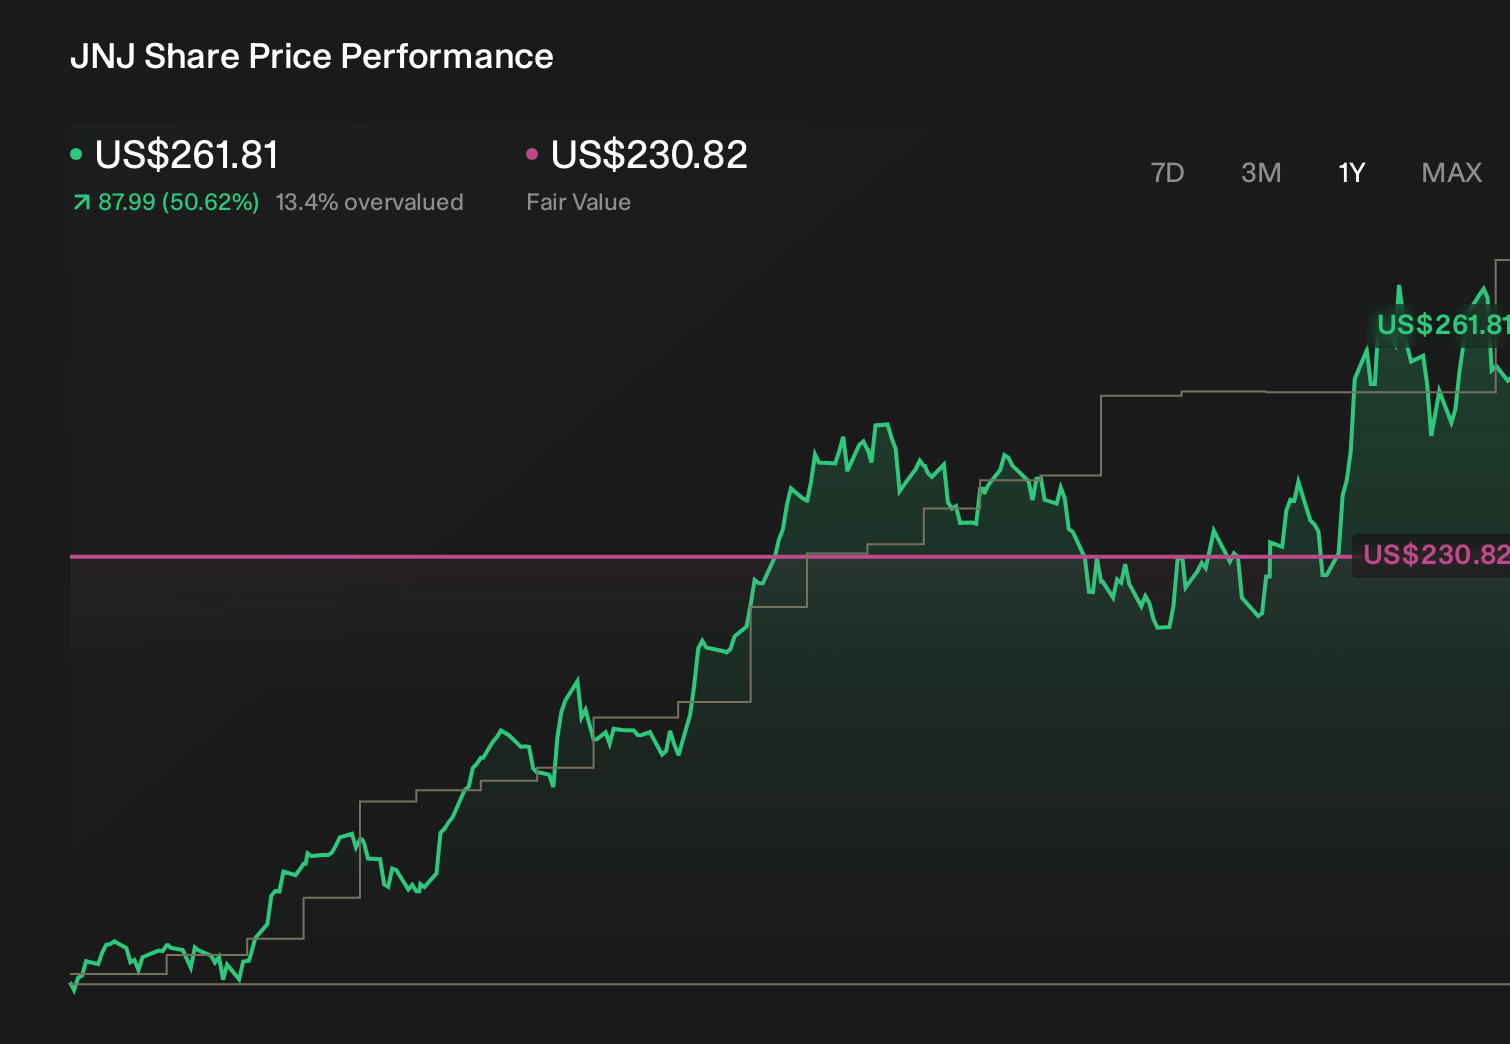
    Johnson & Johnson’s internal projections target US$120.5 billion in revenue and US$28.6 billion in earnings by 2029. Achieving these figures requires a consistent 7.2% annual revenue growth rate and an earnings increase of US$7.6 billion from current levels of US$21.0 billion. Current fair value estimates for the stock sit near US$270.59, representing a 3% upside from its current market price.

    Analyst Perspectives on Execution Risk

    Market sentiment remains divided. More cautious analysts project lower figures, anticipating revenues of approximately US$114.4 billion and earnings near US$22.6 billion by 2029. This bearish perspective is largely rooted in concerns that if the OTTAVA robotics platform scales more slowly than anticipated, MedTech margins could fail to meet expectations. As the market digests the latest regulatory and legal developments, these forecasts remain subject to revision, highlighting the importance of execution in J&J’s long-term strategy.

  • Is Compass (COMP) Stock Overvalued After Recent Gains?

    Is Compass (COMP) Stock Overvalued After Recent Gains?

    Compass (COMP) has delivered an impressive 49.8% return over the past year, but its current valuation suggests the shares may now be trading at a significant premium, leaving investors to question if further upside remains.

    Evaluating the Price-to-Earnings Premium

    The core issue for potential investors is determining whether the current share price fully accounts for recent positive earnings reports or if the market remains overly cautious. A standard metric for this assessment is the P/E ratio, which reveals how much investors are paying for every dollar of Compass’s earnings.

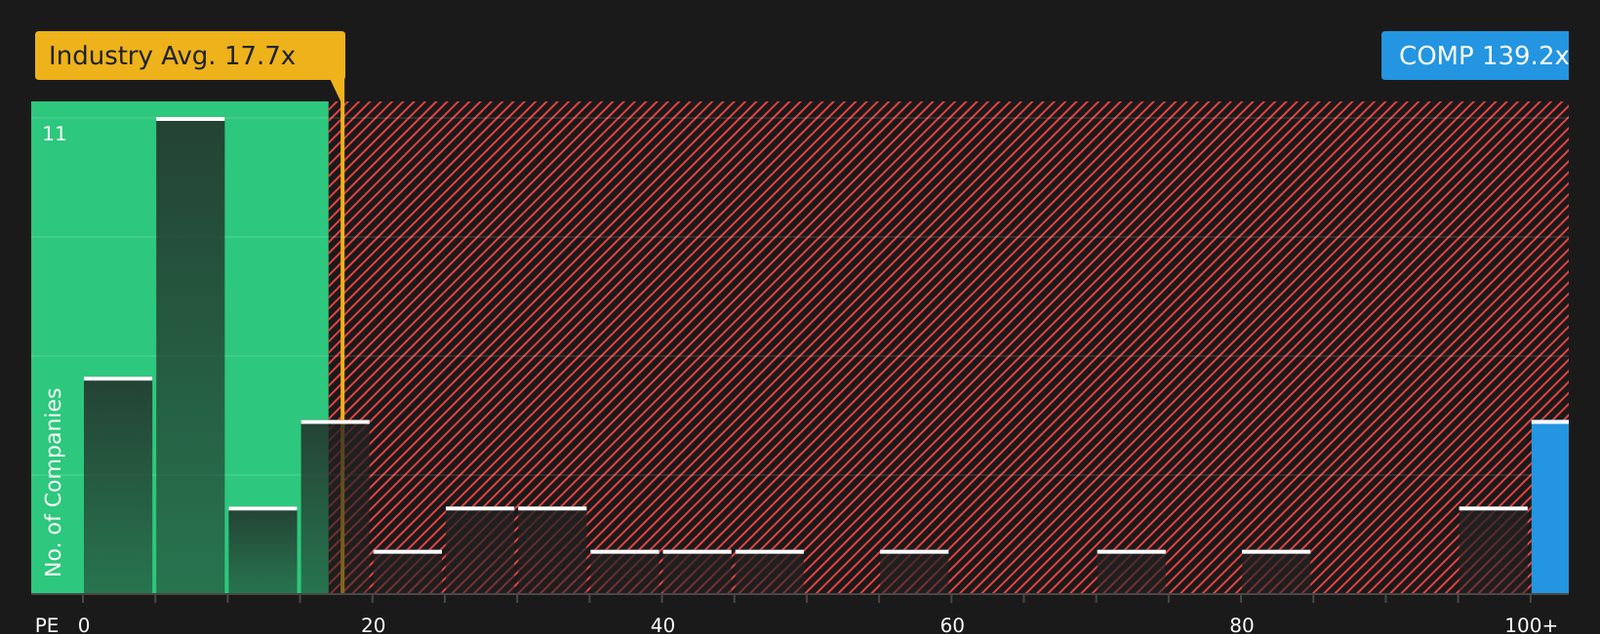
    Currently, Compass trades at a P/E ratio of approximately 139.2x. This figure stands in stark contrast to the broader real estate industry average of 17.7x and the peer group average of 92.1x. When applying a valuation model that accounts for the company’s specific growth profile, margins, size, and risk, a “fair” P/E ratio for Compass sits closer to 43.3x. While this model applies a heavy penalty for the company’s risk profile, the wide gap serves as a clear warning flag that the stock appears expensive based on current earnings.

    Market Optimism vs. Financial Reality

    Despite a strong Q2 earnings beat and optimistic forward guidance, the elevated P/E multiple indicates that the market has already priced in a high level of growth. Investors are effectively paying a premium today for future performance.

    To justify this valuation, Compass must demonstrate sustained progress in earnings and margins. If the company fails to meet these high expectations—or if housing market conditions deteriorate—the stock’s valuation could face pressure to realign with its industry peers.

    Analyzing Future Growth Paths

    The path forward for Compass depends on how its growth, profitability, and risk factors evolve. While the current price reflects significant optimism, further gains are not impossible; however, they would require the company to consistently deliver on its operational targets to make the current, elevated multiple sustainable.

    For investors looking deeper into the numbers, detailed valuation breakdowns and community-driven narratives—which explore various scenarios for growth and margin expansion—provide additional context on how the stock may be perceived relative to its intrinsic value.

  • Draganfly Q2 2026: Revenue Climbs 26% Amid Strategic Growth

    Draganfly Q2 2026: Revenue Climbs 26% Amid Strategic Growth

    Draganfly (NASDAQ:DPRO) announced second-quarter 2026 revenue of CAD 2.7 million, marking a 26% increase from the CAD 2.1 million reported in the same period last year, fueled primarily by robust product sales. Product revenue accounted for CAD 2.6 million of the total, while drone services contributed approximately CAD 100,000.

    Financial Performance and Margin Analysis

    Gross profit reached CAD 533,100, up from CAD 504,000 in Q2 2025. According to Chief Financial Officer Paul Sun, the quarter included a CAD 43,700 non-cash inventory write-down. Excluding this charge, the adjusted gross profit would have been CAD 576,800. The adjusted gross margin stood at 21.7%, a decrease from the 24.3% reported in the prior-year period, a shift Sun attributed to changes in the mix of products and services provided.

    Total comprehensive loss for the company widened to CAD 11.8 million, compared to CAD 4.7 million in the previous year. Sun noted that this increase was driven by higher administrative and office expenses, increased R&D investment, share-based compensation, and professional fees. The results also reflect an CAD 8,900 fair-value loss linked to a derivative liability from a February 2024 financing agreement.

    Sequential Growth and Liquidity

    Revenue saw a sequential increase of 15.2% from the CAD 2.3 million recorded in the first quarter of 2026. Gross margin performance also showed improvement, rising to 20% compared to 15% in Q1. On an adjusted basis, the gross margin reached 21.7% in the second quarter, up from 19.6% in the first quarter.

    Draganfly maintains a strong balance sheet, closing June with CAD 131.9 million in cash, up from CAD 90.2 million at the end of 2025. Total assets rose to CAD 154 million, and the company maintains a working capital surplus of CAD 144 million. CFO Paul Sun confirmed that the firm continues to carry minimal debt.

    Strategic Expansion: Campuses and Public Safety

    CEO and President Cameron Chell highlighted a new exclusive agreement with the International Association of Campus Law Enforcement Administrators (IACLEA). This partnership aims to provide drone and counter-UAS training and products to the association’s network of approximately 3,000 campuses. Initial interest has been high, with over 50 campuses expressing interest; the company plans a measured rollout starting with three campuses next quarter.

    Furthermore, Draganfly has signed the Small and Rural Association. The company’s public-safety strategy prioritizes rural agencies and campuses—which represent roughly 80% of U.S. police forces—over direct competition in saturated large urban markets.

    Acquisitions and Defense Innovation

    The acquisition of Skip Dynamix was finalized during the quarter, bringing essential engineering expertise and technology for thermoplastic fixed-wing aircraft to Draganfly. This technology is designed to support modular payloads and lower-cost production, enhancing the company’s Orca and Dolphin product lines for intelligence, surveillance, and reconnaissance missions.

    In the defense sector, Draganfly secured a DEVCOM contract to develop an ultra-light, mobile counter-drone system. This system is intended for personnel protection and forward operating bases, utilizing a mix of tracking software, kinetic or radio-frequency effectors, and tethered drones. Additionally, a new camera line was introduced through a partnership with Blitz to provide durable, dual-use capabilities for military and commercial applications.

    Looking ahead, Chell indicated that the company is expanding its U.S. facilities and personnel to meet anticipated demand. While acknowledging that revenue growth may be more gradual compared to some competitors, Chell emphasized that Draganfly is prioritizing the development of a comprehensive, integrated product portfolio tailored for industrial, public-safety, and military clients.

  • Is Partners Group Stock a Bargain or a Value Trap?

    Is Partners Group Stock a Bargain or a Value Trap?

    Partners Group Holding (SWX:PGHN) is currently trading at a 38.8% discount to its estimated intrinsic value, sparking debate among investors over whether the stock is significantly undervalued or merely a value trap following a difficult five-year period where shares declined by approximately 44.5%.

    Excess Returns Model Signals Undervaluation

    The Excess Returns model, which evaluates profit generation above the cost of equity, paints a compelling picture for Partners Group. With a Book Value of CHF84.83 per share and a stable EPS of CHF50.15, the company demonstrates a high return on its equity base. When factoring in a Cost of Equity of CHF4.15 per share, the firm maintains an Excess Return of CHF46.00 per share, underpinned by a robust 57.23% Return on Equity.

    These metrics translate into an estimated intrinsic value of CHF1,197 per share. The recent boost in EBITDA margins at Foundation Risk Partners, driven by AI integration, suggests that the market may be underpricing the firm’s future excess returns, leaving the stock appearing undervalued under this specific framework.

    P/E Multiple Analysis

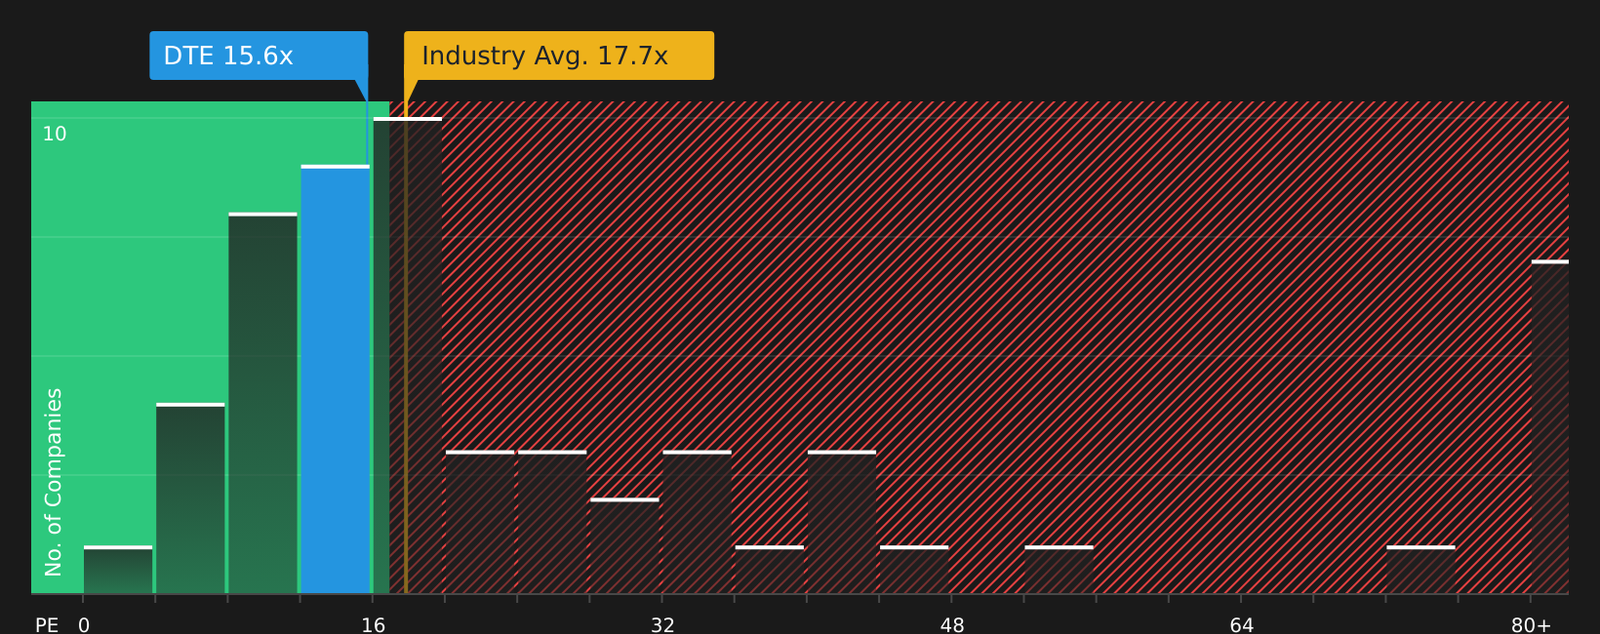
    Beyond the Excess Returns model, the Price-to-Earnings (P/E) ratio provides further insight into the firm’s market standing. Partners Group currently trades at a P/E of roughly 15.0x, notably lower than the Capital Markets industry average of 16.8x and the peer group average of 18.2x.

    When adjusting for margins, scale, and risk profile, the “fair” P/E ratio is estimated at 18.4x. This discrepancy between the current multiple and the model-implied fair value suggests that the market is maintaining a cautious stance, potentially discounting the shares despite the underlying strength of the company’s current earnings.

    Market Sentiment and Future Risks

    The valuation puzzle is further complicated by divergent community narratives. Investors remain split, with one camp identifying significant upside potential while others highlight the dangers of late-cycle risks. Simply Wall St’s community analysis provides a platform to weigh these competing theories, linking specific fair value estimates to potential catalysts and operational risks.

    Ultimately, while both the Excess Returns model and the P/E multiple suggest that Partners Group is undervalued, the market’s current discount may be a reflection of perceived risks rather than a simple mispricing. The path forward depends on the company’s ability to execute its portfolio strategy and efficiency initiatives, which will be critical in convincing the market that its current profitability is sustainable and that the present discount is an opportunity rather than a trap.

  • Jamie Dimon Defends Massive AI Spending as U.S. Economic Engine

    Jamie Dimon Defends Massive AI Spending as U.S. Economic Engine

    JPMorgan CEO Jamie Dimon is pushing back against growing market skepticism regarding AI capital expenditure, arguing that the massive investments by hyperscalers are not a waste of capital but a critical catalyst for U.S. economic growth.

    The Debate Over AI CapEx Fatigue

    Investors are increasingly wary of the “AI fatigue” gripping Wall Street, as tech giants pour billions into data centers, chips, and power infrastructure without providing a concrete timeline for profitability. Recent quarterly results have exacerbated these fears. Alphabet (GOOGL) reported $44.9 billion in capital expenditures for Q2, resulting in a negative free cash flow of $5.9 billion. Similarly, Amazon (AMZN) saw its trailing-12-month free cash flow shift from an $18.2 billion inflow to a $7.6 billion outflow, driven by a $66.1 billion surge in property-and-equipment spending.

    Despite these concerns, AI-focused stocks like Nvidia (NVDA) have delivered massive historical returns. According to Seeking Alpha, Nvidia has generated gains exceeding 390% over the past three years, turning a $10,000 investment into approximately $49,000.

    Dimon’s Bullish Outlook on the Investment Cycle

    Jamie Dimon views the current AI buildout through a different lens, characterizing it as a broad investment cycle that is actively feeding into the wider U.S. economy. Speaking to CNBC, Dimon admitted his projections could be wrong, but maintained that the massive capital outlay will ultimately “play out and pay out.”

    He argues that these corporations are not spending blindly. Instead, they are responding to a structural shift in demand. While initial model training requires significant upfront investment, the ongoing need for inference—the actual operation of AI systems—creates a sustained demand for advanced chips, servers, networking hardware, and energy. “The need is going up dramatically,” Dimon noted, suggesting that the current infrastructure race is fueled by genuine usage rather than mere hype.

    Spillover Effects and GDP Impact

    Dimon estimates that AI-related spending will contribute roughly 1% to U.S. GDP this year, with a similar impact expected in 2025. This goes beyond the borders of Silicon Valley, impacting industrial sectors including steel, cement, utilities, and engineering. Data supports this: U.S. private data-center construction spending reached an annualized $68.3 billion in June, representing a 45.8% year-over-year increase.

    When asked about the potential for investors to sour on AI, Dimon indicated that it was not a primary concern on his list of risks.

    JPMorgan’s Internal AI Strategy

    Dimon’s confidence is bolstered by JPMorgan’s own deep integration of AI. The bank is currently allocating $20 billion annually toward technology across 6,000 different applications. Their internal large-language-model platform is utilized by 150,000 employees weekly, with internal estimates suggesting a savings of four hours per person, per week. The bank currently tracks roughly 1,000 AI use cases, ranging from fraud detection and risk management to document analysis.

    Furthermore, JPMorgan is actively monetizing the AI boom. In Q2, the bank’s investment-banking revenue surged 45% year-over-year to $3.9 billion, supported by strong equity underwriting, including acting as a bookrunner for major capital raises.

    The Concentration Risk

    Despite the optimism, the current AI spending cycle remains highly concentrated. Statista projects that Amazon, Alphabet, Microsoft (MSFT), and Meta Platforms (META) will collectively spend between $735 billion and $760 billion on capital expenditures by 2026. Amazon alone accounts for roughly $220 billion of that projected total.

    While there is evidence of commercial returns—such as Alphabet’s cloud sales surging 82% to $24.8 billion and Microsoft’s Azure reporting 40% growth—the reliance on a small group of companies remains a point of contention. For instance, Microsoft’s massive commercial backlog growth is heavily influenced by OpenAI commitments, highlighting how dependent the ecosystem is on a limited number of major players.

    The Federal Reserve has also noted that while AI investment is boosting growth, the reliance on imported servers and equipment partially offsets domestic GDP benefits. Furthermore, while corporate adoption is rising, Fed research suggests that usage remains “shallow” at many firms. As it stands, the long-term success of the AI trade remains tethered to the sustained, historically high spending levels of a handful of tech giants.

    Related: Palantir CEO escalates Microsoft’s AI warning

  • Coincheck Q1 Earnings: Revenue Soars 36% Amid Crypto Strategy

    Coincheck Q1 Earnings: Revenue Soars 36% Amid Crypto Strategy

    Coincheck Group (NASDAQ:CNCK) reported a 36% year-over-year revenue increase to JPY 114.3 billion ($703 million) for the fiscal quarter ending June 30, 2026, driven by robust institutional transaction activity and the integration of its 3iQ asset-management business.

    Financial Performance and Revenue Drivers

    CFO Jason Sandberg confirmed that the revenue surge was primarily fueled by institutional transaction volume and counterparty activity. Adjusted revenue climbed 19% to JPY 2.92 billion ($18 million), a growth trajectory largely attributed to increased staking revenue and the first full quarter of 3iQ operations following the acquisition on March 1, 2026.

    While the company narrowed its net loss to JPY 1.18 billion ($7.2 million) compared to JPY 1.37 billion in the previous year, adjusted EBITDA loss widened to JPY 516 million ($3.2 million). This shift reflects higher selling, general, and administrative expenses tied to the 3iQ integration. The firm concluded the quarter with a solid liquidity position of JPY 16.1 billion ($98.9 million) in cash and equivalents.

    Operational Metrics and Market Challenges

    Coincheck’s reach expanded as verified accounts grew 12% year over year, reaching 2.63 million by the end of June. This growth was bolstered by strategic partnerships, including the integration with the consumer marketplace Mercari.

    Conversely, customer assets under management on the platform declined 37% to JPY 631.6 billion ($3.9 billion), a dip management attributed to lower market valuations for major assets like Bitcoin, Ethereum, and XRP. Marketplace trading volume also saw a slight contraction of 4%, settling at JPY 59.1 billion ($363 million).

    The “Three-Legged Stool” Strategy

    CEO Pascal St-Jean outlined a strategic framework centered on Crypto-as-a-Service, asset management, and custody services. The objective is to capture the expanding regulated crypto market in Japan by serving both retail and institutional segments.

    Key partnerships remain central to this roadmap. The Crypto-as-a-Service model with Mercari is now fully operational, while the alliance with KDDI—which holds a 14.9% equity stake in Coincheck—continues to drive mutual customer referrals. Additionally, a new partnership with Credit Saison will allow cardholders to utilize loyalty points for crypto investments, with Coincheck providing the underlying infrastructure.

    Institutional Expansion and Global Reach

    The acquisition of 3iQ is already yielding results. The subsidiary has been selected as a sub-adviser for Dynamic Funds’ multi-crypto ETF and was appointed to manage a portion of Bhutan’s Bitcoin treasury. St-Jean noted that 3iQ is actively pursuing distribution arrangements in Switzerland, Canada, and Abu Dhabi, with potential for further expansion in Japan beyond standard ETF products.

    Regarding regulatory landscapes, St-Jean emphasized that Japan’s evolving cybersecurity policies and supervisory guidelines are paving the way for institutional-grade custody solutions. Coincheck is currently developing these capabilities to cater to trust banks and qualified institutional investors.

    Future Outlook and Branding

    The company maintains a three-stage market development roadmap: establishing institutional participation, launching spot ETFs and investment funds, and advocating for favorable tax treatment. With the “introducing broker” framework now live, management expects the next major institutional product milestone toward the end of 2027.

    Looking ahead, Coincheck is finalizing the integration of its Aplo and NFT business units. The firm plans to unveil a new name and brand identity for its unified platform later this year.