
Blog

  • Oncocyte Targets FDA Approval for GraftAssureDx This Year

    Oncocyte (NASDAQ:IMDX) remains on track to secure FDA marketing authorization for its GraftAssureDx kidney-transplant rejection test by the end of 2024, despite ongoing regulatory inquiries and a strategic focus on managing capital ahead of commercial launch.

    Navigating the FDA Regulatory Path

    During the company’s second-quarter earnings call, President and CEO Josh Riggs addressed a July FDA letter requesting additional data and clarification regarding the product’s intended use. Riggs characterized the request as a routine element of the Class II review process. To bolster its position, the company has tripled the sample size collected for its study since the initial March submission.

    Before resubmitting its data package, Oncocyte plans to conduct a Submission Issue Request (SIR) meeting with the FDA. This session is designed to secure direct written feedback and ensure full alignment with agency requirements. While Riggs noted that the exact timeline of government review remains outside the firm’s direct control, he emphasized that the FDA’s questions were predictable and addressable using existing internal data.

    European Expansion and Regulatory Flexibility

    Chief Science Officer Ekkehard Schütz highlighted a more flexible regulatory environment in Europe. Following consultations regarding the In Vitro Diagnostic Regulation (IVDR), the company expects to complete its submission in the second half of the year without the need for large-scale clinical studies. Furthermore, self-certification pathways in the United Kingdom are expected to streamline market entry.

    Early market-access indicators are already appearing in Europe, with reimbursement progress noted in Switzerland and active tenders in Italy. Oncocyte believes that the broader adoption of anti-CD38 therapies will likely serve as a catalyst for growth in these regions.

    Medicare Tailwinds and Market Strategy

    Management identified expanded Medicare reimbursement guidelines as a significant commercial driver. Recent local coverage determinations from MolDX, which increased covered surveillance tests from eight to 14 during the first three years post-transplant, provide a strong economic incentive for centers to adopt in-house donor-derived cell-free DNA (dd-cfDNA) testing.

    Riggs noted that over half of the top 10 U.S. transplant centers are currently engaged with Oncocyte through its FDA program or registry. This traction is supported by head-to-head clinical data demonstrating that the company’s assay is equivalent to tests currently performed at centralized laboratories.

    Financial Outlook and Operational Efficiency

    CFO Andrea James reported an adjusted EBITDA loss of $7.8 million for the second quarter, with cash burn reaching $10 million. Management anticipates this figure represents the near-term peak for cash expenditure. The company continues to generate modest revenue from laboratory services, research-use-only kits, and its “GraftAssure CORE” laboratory-developed test, which is reimbursable at $2,753 per result.

    Should FDA authorization face delays, the company is prepared to accelerate registry enrollment to offset costs and extend its cash runway. Looking ahead, Oncocyte maintains a $2 billion total addressable market estimate for kitted transplant-organ testing, with potential for further expansion into heart-transplant monitoring.

    Strategic Partnerships and Future Growth

    Oncocyte is leveraging its relationship with Bio-Rad to optimize its testing platform placement across transplant centers and reference laboratories. As the company prepares for its next phase of growth, it remains focused on clinical utility, recently announcing a key opinion leader call for August 17 to discuss the integration of in-house dd-cfDNA testing for heart-transplant monitoring.

  • US Dollar Forecast: Will July CPI Data Trigger a DXY Rally?

    US Dollar Forecast: Will July CPI Data Trigger a DXY Rally?

    The U.S. Dollar Index (DXY) faces a pivotal moment this week as investors await July’s Consumer Price Index (CPI) data, scheduled for release this Wednesday. This report will serve as the primary catalyst for the Federal Reserve’s next move, determining whether the central bank maintains its current rate pause or resumes aggressive tightening in September.

    Inflation Data and Fed Policy Outlook

    Economists are projecting a 0.2% month-on-month increase in core CPI. Should the data align with these forecasts, it would signal that inflation is steadily moving toward the Fed’s 2% target. For context, the Fed’s preferred core inflation measure stood at 3.3% in June, with an annual increase of 2.8%.

    Interest rate expectations have become increasingly volatile. Persistent inflation and regional energy shocks are testing the Fed’s recent decision to hold rates steady, despite internal dissent. Furthermore, political tensions—specifically attempts to challenge the Fed’s autonomy—are adding a layer of fundamental risk to the dollar’s outlook.

    Currency Markets: Euro and Sterling Dynamics

    The Euro is navigating significant uncertainty. Recent reports suggest the Japanese Yen was bolstered by U.S. Treasury dollar-selling, raising questions regarding currency coordination and whether the Treasury is balancing support for the dollar while mitigating pressure on bond markets. Consequently, the European Central Bank (ECB) is expected to maintain its current policy trajectory.

    Meanwhile, the British Pound is bracing for second-quarter UK GDP data. Analysts expect growth of approximately 0.4% for Q2, following a 0.6% expansion in Q1. Despite ongoing supply chain disruptions and geopolitical friction involving Iran, the UK economy has shown resilience. Stronger-than-expected figures would likely embolden the Bank of England to sharpen its focus on inflation risks, influencing the broader performance of the USD, EUR, and GBP.

    DXY Technical Analysis: Bears Still in Control

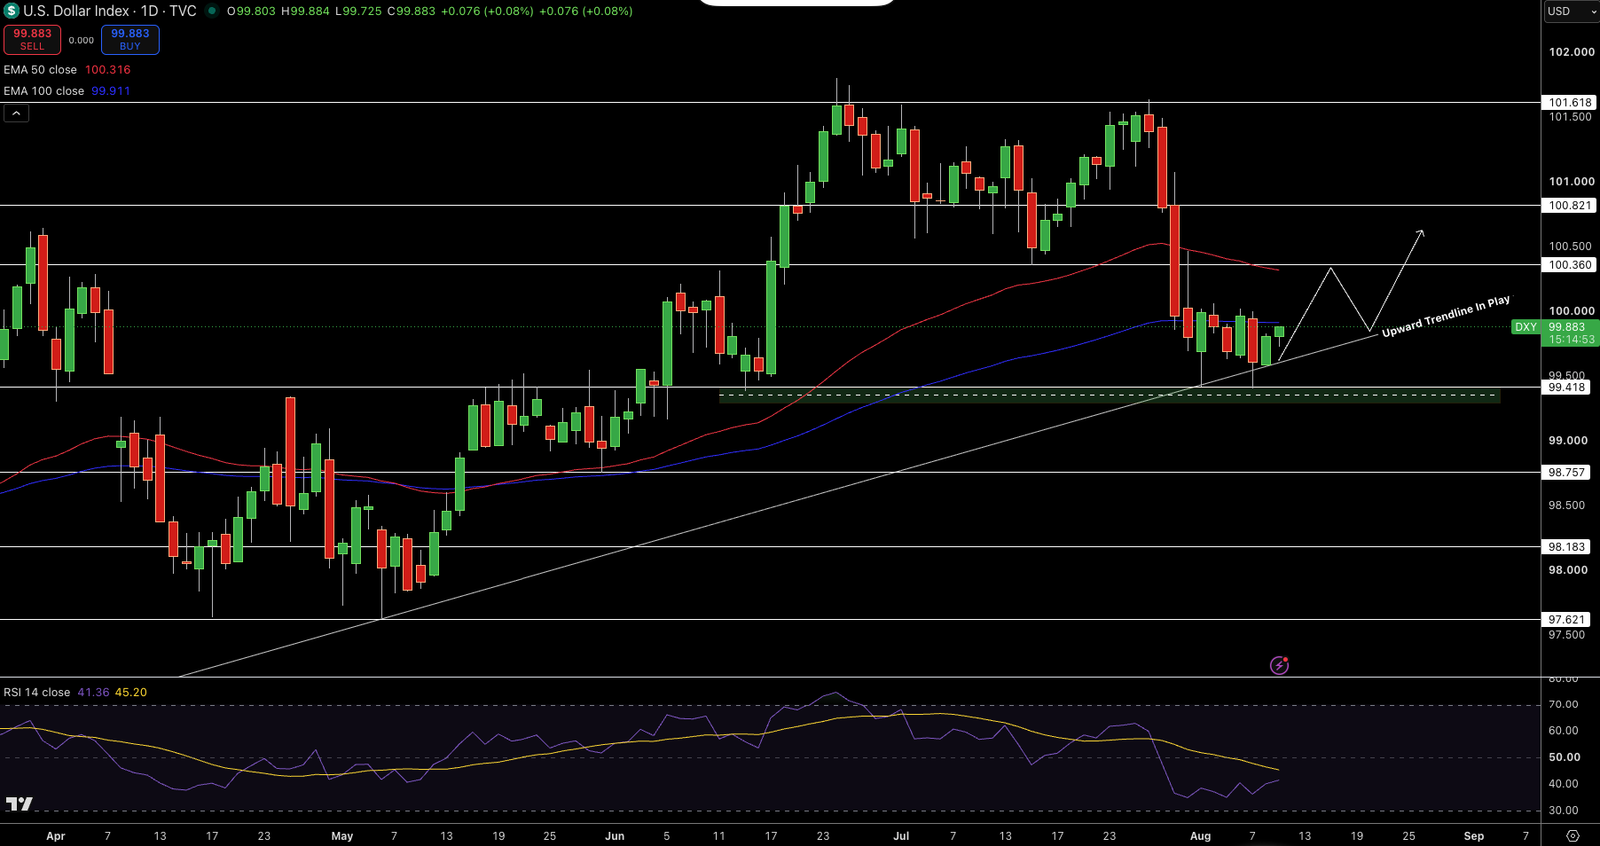
    The US Dollar Index is currently trading at $99.88. While the index holds above a rising trendline and horizontal support at $99.42, it remains trapped below the 50-day EMA ($100.32) and the 100-day EMA ($99.91), indicating that bearish sentiment persists. Current buying pressure is insufficient to confirm a bullish reversal.

    The Relative Strength Index (RSI) sits at 41, suggesting that while extreme selling pressure has eased, the index has yet to reclaim neutral territory. Resistance levels are pegged at $100.36, $100.82, and $101.62. Should the index break below $99.42, further support is anticipated at $98.76 and $98.18.

    GBP/USD and EUR/USD Trends

    The GBP/USD pair is trading near $1.3499, maintaining a bullish structure above its rising trendline and moving averages ($1.3456 and $1.3427). With an RSI of 58, the pair shows healthy momentum. A decisive break above $1.3516 could trigger a move toward $1.3559, while support remains steady at $1.3437.

    Conversely, EUR/USD is trading at $1.1534, struggling against a long-term falling trendline. The pair is positioned below the 50-day MA ($1.1496), and buyers appear to be losing momentum near the $1.1556 resistance level. While the RSI at 58 suggests potential for growth, a clean breakout above resistance is required to shift the trend. Immediate support for the Euro stands at $1.1455, with a critical floor at $1.1357.

  • Unemployment Hits Record Lows: Is the Job Market Actually Weak?

    Unemployment Hits Record Lows: Is the Job Market Actually Weak?

    The U.S. labor market has officially entered the history books, maintaining an unemployment rate of 4.5% or lower for 57 consecutive months—the longest streak since 1970—yet analysts warn that this historic low does not necessarily signal a robust economy.

    A Record-Breaking Streak Under Scrutiny

    In July, the unemployment rate edged down from 4.2% to 4.1%, reaching its lowest point in over a year. While this milestone underscores a sustained period of low joblessness, the underlying data reveals a more complex reality. Job creation has noticeably faltered since 2025 as employers exercise caution in their hiring practices.

    Why Hiring Has Stalled

    Corporate expansion has hit a plateau over the past year. Businesses are pulling back on recruitment, citing significant macroeconomic uncertainties, including international trade tariffs, ongoing geopolitical tensions in Iran, and the rapid, disruptive integration of artificial intelligence across various industries.

    The Hidden Reality Behind the Numbers

    The primary reason the unemployment rate has not climbed despite sluggish hiring is a decline in workforce participation; fewer people are actively seeking employment. This phenomenon is reflected in the Conference Board’s consumer confidence survey, which shows that the general public remains largely pessimistic about the current ease of finding new work.

    What This Means for the Federal Reserve

    Despite these headwinds, the persistently low unemployment rate provides the Federal Reserve with a strategic advantage. It allows policymakers to shift their primary focus toward the other half of their dual mandate: controlling inflation to ensure stable consumer prices.

    Interest Rate Forecasts and Market Sentiment

    Financial markets currently see no indication that the Fed will be forced to cut interest rates to stimulate the labor market this year. Instead, data from the CME Group’s FedWatch tool suggests an 80% probability that the Federal Reserve will raise the fed funds rate by at least a quarter-point before year-end to combat persistent inflation.

    Supply vs. Demand: An Economic Perspective

    “From the Fed’s perspective, the labor market is at full employment and the economy cannot create jobs from people who are not here,” noted John Ryding, chief economic advisor at Brean Capital. Ryding further emphasized that the current report is not a reflection of weak economic demand, but rather a direct result of a structural shortage in the labor supply.

  • Forget Big Oil: This Midstream Stock Offers Higher Yields

    Forget Big Oil: This Midstream Stock Offers Higher Yields

    Enterprise Products Partners (NYSE: EPD) has emerged as a superior alternative to integrated energy giants like Chevron and ExxonMobil for income-focused investors, offering a significantly higher dividend yield and exceptional cash flow stability.

    The Midstream Advantage Over Upstream Giants

    While industry titans Chevron and ExxonMobil are celebrated for their decades-long dividend growth streaks, they often fall short in providing competitive yields. Unlike upstream oil drillers, which remain highly susceptible to volatile commodity price swings, Enterprise Products Partners functions as the “highway system” for North American energy.

    The company maintains a massive infrastructure footprint, boasting 50,000 miles of pipelines, 21 deep-water docks, and 300 million barrels of liquid storage capacity. This physical dominance creates a formidable barrier to entry and a reliable foundation for revenue.

    Business Model Built for Stability

    Enterprise mitigates market risk through a strategic fee-based business model. Approximately 80% of its gross operating margin is derived from volume-based fees rather than the fluctuating spot prices of oil and gas. Furthermore, nearly 90% of its long-term contracts include built-in escalation provisions to hedge against inflationary pressures.

    This structural resilience was on full display in the second quarter, where the firm reported record EBITDA of $2.8 billion and earnings per share of $0.84, both surpassing consensus estimates.

    Operational Growth and Dividend Strength

    The company’s recent performance was fueled by a surge in demand for U.S. energy. Total pipeline-equivalent volumes increased by 8% to 14.7 million barrels per day (MMBPD), while marine terminal volumes saw a dramatic 33% spike, reaching 2.8 MMBPD. Enterprise continues to expand its footprint with new processing facilities in the Permian Basin, a critical engine for its ongoing growth.

    Currently, Enterprise Products Partners offers a 5.9% dividend yield, substantially outperforming Chevron’s 3.7% and ExxonMobil’s 2.6%. This payout is backed by a 28-year streak of consecutive distribution increases.

    Understanding the MLP Structure

    As a master limited partnership (MLP), Enterprise operates as a pass-through entity that avoids corporate income tax, distributing profits directly to unitholders. While this structure offers significant tax-deferral advantages, investors should be aware that the company issues a Schedule K-1 for tax purposes, which necessitates a more detailed approach during tax filing season.

  • American Vanguard Q2 2026 Earnings: Key Takeaways

    American Vanguard Q2 2026 Earnings: Key Takeaways

    American Vanguard Corporation (NYSE: AVD) released its financial results for the second quarter of 2026, detailing the company’s performance, operational shifts, and strategic outlook for the remainder of the fiscal year.

    Q2 2026 Financial Performance Overview

    The earnings report highlights the company’s revenue streams and profit margins during the three-month period ending June 30, 2026. Management focused on addressing market volatility and supply chain adjustments that impacted the agricultural and specialty chemical segments throughout the quarter.

    Strategic Operational Updates

    During the earnings call, leadership outlined specific initiatives aimed at improving operational efficiency. These updates include a transition toward higher-margin product lines and a reduction in overhead costs, which the company expects will stabilize its balance sheet in the coming quarters.

    Market Outlook and Future Projections

    American Vanguard provided guidance for the second half of 2026, emphasizing its commitment to research and development. The executive team addressed investor concerns regarding competitive pressures and outlined their roadmap for navigating the current economic landscape, focusing on sustained growth within their core markets.

  • Oil Prices Hit $92.54: Why Your Gas Bill Is Surging

    Oil Prices Hit $92.54: Why Your Gas Bill Is Surging

    As of 6:20 a.m. ET on August 11, 2026, Brent crude oil is trading at $92.54 per barrel, marking a sharp $4.99 increase from yesterday and a significant $25.38 jump compared to this time last year.

    The Volatile Drivers of Oil Markets

    Market direction remains notoriously difficult to predict, as it is tethered to the fundamental forces of supply and demand. Heightened geopolitical tensions, the looming threat of recession, and global conflict remain the primary catalysts that can shift pricing trends almost instantaneously.

    From Crude Barrel to Gas Pump

    While crude oil typically accounts for over half of the price you pay at the pump, the final cost is a cumulative reflection of the entire supply chain. This includes refining costs, wholesale distribution, taxation, and local station markups.

    Consumers often experience the “rockets and feathers” effect: gas prices climb rapidly when oil spikes, but descend with frustrating sluggishness when crude costs fall.

    Strategic Reserves and Economic Protection

    To mitigate supply shocks, the U.S. maintains the Strategic Petroleum Reserve. This emergency stockpile serves as a buffer during crises—such as war, natural disasters, or severe trade sanctions—to ensure that essential services, public transit, and critical industries remain operational. It is a tactical tool for short-term stability rather than a permanent solution to long-term energy imbalances.

    Interconnected Energy Markets

    Oil and natural gas prices are deeply linked. When oil becomes significantly more expensive, industries often pivot to natural gas for specific operational needs, which in turn drives up demand and prices for natural gas as well.

    Understanding the Brent Benchmark

    Global oil performance is primarily measured through two benchmarks, with Brent serving as the international standard. Because it prices a vast majority of the world’s traded crude, it is the preferred metric for historical trend analysis. Even the U.S. Energy Information Administration has adopted Brent as its primary reference for the Annual Energy Outlook.

    Historical data reveals that oil prices are rarely stable, having endured drastic fluctuations tied to global recessions, periods of oversupply—or “gluts”—and supply cuts triggered by international conflict.

    Frequently Asked Questions

    What determines the price of oil?

    Beyond basic supply and demand, geopolitical news and OPEC+ production decisions are critical influencers. In the U.S., domestic policy plays a major role; for instance, the 2025 decision by the Trump administration to reopen over 1.5 million acres of the Arctic National Wildlife Refuge for leasing marked a significant shift from previous policies aimed at limiting Arctic drilling.

    How frequently do prices shift?

    Oil prices are in a constant state of flux while futures markets are active. These markets function as continuous auctions where contracts for future delivery are traded, ensuring that the price reflects the latest market sentiment in real-time.

    The Role of U.S. Shale

    Shale rock, which holds vast deposits of oil and gas, acts as a crucial lever for energy supply. Increased access to U.S. shale reserves helps stabilize the market by providing a domestic buffer, which can prevent extreme price spikes during global supply shortages.

    Economic Impact and Inflation

    Higher oil prices act as an inflationary force, increasing the cost of both energy utilities and the logistics of consumer goods. When fuel costs rise, the price of transporting goods from farms and warehouses to retail shelves increases, ultimately forcing higher prices onto the consumer at the checkout counter.

  • Wendy’s Stock: Is the 9% Undervaluation a Buy Signal?

    Wendy’s Stock: Is the 9% Undervaluation a Buy Signal?

    Wendy’s (WEN) is currently under intense market scrutiny following a disappointing quarterly performance, a dividend cut, and the formal withdrawal of its 2026 financial guidance as new leadership attempts to execute a strategic turnaround to combat declining sales and brand fatigue.

    Market Reaction and Financial Pressure

    The convergence of weak quarterly results, reduced shareholder payouts, and the abandonment of long-term financial targets has placed significant downward pressure on the stock. Shares have suffered a 5.07% decline in a single day, contributing to a 24.23% drop in total shareholder return over the past year. This loss of momentum forces investors to re-evaluate the company’s risk profile against its potential for recovery at the current US$7.30 share price.

    Evaluating Valuation and Fair Value

    With the stock trading near the US$7.30 mark following the recent sell-off, market participants are divided between viewing this as an opportunistic entry point or a signal to wait for concrete evidence of operational success. Current valuation models place the fair value of Wendy’s at approximately US$7.98. This estimate suggests a modest 9% undervaluation, providing a benchmark for how the market may value future execution.

    The Assumptions Behind the Numbers

    The narrative supporting this valuation relies on assumptions of steady top-line growth, albeit with tighter margins and a future earnings multiple that remains conservative compared to hospitality industry peers. The validity of this $7.98 fair value depends heavily on specific combinations of revenue growth, profitability metrics, and the applied discount rate.

    Risks to the Turnaround Strategy

    The thesis for a potential rebound faces significant headwinds. The fair value narrative could be quickly invalidated if franchise economics continue to soften or if persistent inflationary pressures—specifically regarding commodities and labor wages—further compress Wendy’s margins. Such factors could effectively stall the turnaround narrative, leaving the company vulnerable to continued volatility.

    Investors assessing the current state of Wendy’s must weigh these fundamental risks against the projected upside. A thorough review of the company’s current rewards and warning signs is essential for those determining whether the stock’s current discount reflects a genuine opportunity or a value trap.

  • P3 Health Partners Q2 Earnings: Profit Soars, Outlook Raised

    P3 Health Partners Q2 Earnings: Profit Soars, Outlook Raised

    P3 Health Partners (NASDAQ:PIII) announced a strong second-quarter performance, reporting $54 million in adjusted EBITDA and officially raising its full-year 2026 outlook. This growth was bolstered by $45 million in favorable payer settlements and prior-year development, signaling a significant turnaround from the same period last year.

    Operational Turnaround and Financial Performance

    CEO Aric Coffman attributed the positive results to rigorous execution in contract restructuring, network concentration, and medical-cost management. The company reported $80 million in adjusted EBITDA for the first half of 2026, a massive shift compared to the $39 million loss recorded during the first half of 2025.

    “The core economic levers that drive the business, our contract structure, our operating model, and our clinical execution are increasingly within our control,” Coffman stated.

    Quarterly revenue reached $386 million, up from $356 million year-over-year, despite a reduction in the at-risk membership base. CFO Leif Pedersen noted that per-member funding grew by approximately 15%, driven by rate progression and enhanced documentation of illness burden.

    Membership Strategy and Claims Management

    At-risk membership stood at roughly 105,000 at the end of Q2, down from 116,000 a year prior. Pedersen explained that this decline was a strategic move from 2025 to exit arrangements that failed to meet the company’s economic thresholds. Including management-services agreements, P3 currently oversees approximately 133,000 lives.

    Medical claims expenses totaled $269 million for the quarter. Crucially, Pedersen clarified that $41 million of the $45 million in favorable settlements was recorded specifically within medical claims expense rather than as revenue.

    Excluding these settlements, the underlying adjusted EBITDA for the second quarter was approximately $9 million. For the first half of the year, the underlying adjusted EBITDA was negative $18 million, bolstered by a total of $62 million in settlements and prior-year developments recognized over the six-month period.

    Clinical Efficiency and Technology Adoption

    Management highlighted that its Medicare Advantage medical-cost trend for the first half of 2026 was 1.8% below the 2025 baseline—a stark contrast to industry peers seeing 5% to 7% increases. Chief Medical Officer Amir Bacchus credited this success to the rapid deployment of point-of-care technology.

    These tools are currently active across more than 65,000 lives, with providers addressing nearly 90% of care gaps during visits. Furthermore, P3’s network engaged 87% of patients in Q2, while successfully reaching 99.5% of its highest-risk members.

    The company also saw success in utilization management, achieving a 17% year-to-date redirect rate from skilled nursing facilities to more appropriate home-based care settings. Quality performance metrics, including HEDIS and medication adherence, remain ahead of internal targets.

    2026 Outlook and Future Expansion

    P3 ended the quarter with $21 million in cash and equivalents. With improved expectations for the remainder of the year, the company raised its full-year 2026 adjusted EBITDA guidance to a range of $80 million to $110 million, with a midpoint of $95 million.

    Looking ahead, the company plans to navigate the typical seasonal increase in medical expenses during the second half of the year through continued care management and payment-integrity programs.

    Regarding its Nebraska expansion, Coffman confirmed that P3 will continue services through 2027 while scaling programs, with a full-risk arrangement not expected until 2028. Additionally, the company does not anticipate that current Medicare Advantage county exits by other plans will significantly impact its membership, promising more clarity on 2027 benefit designs following the third-quarter results.

  • Dave Ramsey: Why Your Kid’s College Brand Doesn’t Matter

    Dave Ramsey: Why Your Kid’s College Brand Doesn’t Matter

    Dave Ramsey recently advised a single mother from Boston on The Ramsey Show regarding the financial feasibility of sending her son to a $93,000-a-year private college, emphasizing that the prestige of an institution is secondary to the actual out-of-pocket cost and student performance.

    The Reality of College Costs vs. Sticker Price

    Renee, a single parent earning $113,000 annually, faced a dilemma: her son, an economics major and recruited Division III football player, received $72,000 in need-based scholarships. This left a remaining annual balance of $14,000. While Renee earns above the median U.S. income, balancing this tuition alongside daily living expenses in an era where average household expenditures hover near $78,535 presents a significant financial hurdle.

    Ramsey’s verdict was blunt: "Where you go to school does not matter. Whether you go to class or play beer pong matters. Whether you learn something while you’re there matters."

    The Math Behind the Degree

    Ramsey framed the $14,000 annual expense as a manageable figure, noting that the institutional aid effectively brought the private school’s cost down to the level of a typical state university. He argued that the "sticker price" is often a prestige signal, while the "net price" is the only number that impacts a family’s long-term financial health.

    "If you can do this and he can play football for four years and you can come out of pocket $14,000 a year and cash flow it for four years and he gets a degree for the equivalent of $60,000 out of pocket, then that’s not going to be a bad deal," Ramsey stated.

    Risk Management and Financial Boundaries

    Despite his approval, Ramsey set a rigid boundary: the plan only works if the aid remains consistent. He warned that if scholarships are rescinded or if the student suffers an injury that ends his football career, the family must be prepared to pivot immediately.

    "If they rescind these scholarships and he gets hurt playing football, then he’s going to a different school if he’s mine," Ramsey cautioned. "Because we’re not coming out of pocket $50 grand so you can finish up where they started me with a $70,000."

    Credentials vs. Competence

    Ramsey’s core philosophy remains that employers prioritize skills over the name on a diploma. He pointed out that 78% of Fortune 500 CEOs graduated from state schools, reinforcing the idea that for an economics major, internships, GPA, and practical experience far outweigh the branding of an expensive private institution.

    Ultimately, the advice serves as a reminder to parents: if the net price of a private education aligns with that of a state school, it is a viable option. However, if the discount disappears, the student should be prepared to transfer rather than resort to student loans, which already total $1.85 trillion across the U.S. market.

  • Lundin Gold Q2 2026: Record Output and Expansion Strategy

    Lundin Gold Q2 2026: Record Output and Expansion Strategy

    Lundin Gold Inc. (LUGDF) reported a robust second quarter for 2026, characterized by strong production performance and a strategic focus on long-term output sustainability, according to the company’s recent earnings call.

    Operational Throughput and Mill Performance

    During the second quarter, the mill averaged nearly 6,000 tonnes per day in June, despite scheduled maintenance downtime earlier in the period. While the official guidance remains set at 5,500 tonnes per day for the remainder of the year, COO Terry Smith noted that this higher throughput represents an operational upside the team continues to pursue.

    Production Targets and Mine Expansion

    Addressing questions regarding the mill expansion and simultaneous operations from the north and south portals, President and CEO Jamie Beck clarified the company’s strategy. Rather than aggressively pushing production significantly beyond the 500,000-ounce annual mark, the increased throughput is intended to offset declining ore grades. This approach aims to maintain the current annual production level for a longer duration as the mine matures toward its reserve grade.

    Optimization of Gold Recoveries

    Recovery rates saw a significant boost in June, reaching 89%, with management eyeing a target of 90-91%. This improvement is credited to a more refined reclassification of the ore body and enhanced blending techniques. Further gains are expected as additional projects from the mine-to-mill expansion study are integrated into the operation.

    Financial Results and the LUNAR Transaction

    CFO Chester See reported strong financial metrics for the quarter, with net revenues reaching $478 million and income from mining operations totaling $337 million. The LUNAR transaction introduced a one-time non-cash fair value loss of $75 million related to dividend distributions; however, this was effectively countered by a $127 million non-cash gain from the revaluation of the Silver Stream obligation. Adjusted earnings were reported at $202 million, or $0.84 per share, with an adjusted EBITDA of $347 million.

    Cash Flow and Capital Allocation

    Despite heavy annual tax and profit-sharing payments totaling $221 million—reflecting the strong performance of 2025—Lundin Gold generated $96 million in free cash flow ($0.40 per share). The company closed the first half of the year with a solid cash position of $507 million and $445 million in working capital. Regarding potential future copper mine development, management remains debt-free and flexible, keeping all financing options open as they work toward a maiden resource estimate in early 2027.

    Development and Exploration Milestones

    The mine-to-mill expansion study is on schedule for completion by year-end, with a primary focus on integrating FDNS into the long-term plan. Development progress is steady, with 370 meters completed at FDNS and the commencement of development toward FDN East in July to facilitate further drilling. Exploration highlights were significant, including a record-breaking interval at FDN East of 4 meters at 236.6 g/t gold and the discovery of two new copper-gold porphyries, bringing the total to seven.

    Outlook for the Second Half of 2026

    With the second quarter serving as the anticipated low point for production, Lundin Gold has reaffirmed its full-year guidance of 475,000 to 525,000 ounces. Key priorities for the remainder of the year include finalizing the mine-to-mill study, accelerating FDNS development, ramping up regional exploration, and maintaining the commitment to return 100% of normalized free cash flow to shareholders.